Debating Bill 108: How Economics 101 Can Help Planners Understand the Impact of Bill 108 on Housing Affordability
By: Frank Clayton and Diana Petramala
June 14, 2019
Bill 108 (More Homes, More Choice), which will allow the Ontario government to implement its Housing Supply Action Plan, received Royal Assent on June 6, 2019. These combined policy moves are intended to improve housing affordability in the Greater Toronto Area (GTA) and the rest of Ontario by delivering more serviced sites to the marketplace, shortening the time frame for land use approvals, lowering development costs, and reducing uncertainty for developers. These measures will lower the costs of producing new housing and, in a competitive marketplace like the GTA, will ultimately result in lower housing prices and rents than would otherwise be the case.
Many planners have not considered the workings of the housing marketplace and have reached the conclusion that further regulation is required to ensure the benefits of these measures will be passed along to buyers or renters of new housing. These planners seem to agree that Bill 108 will lead to more supply and lower development costs, but they doubt that it will lead to better affordability, which contradicts economic theory and empirical evidence.
A lack of understanding of how the housing market responds to lower development costs, faster approvals and more certainty is commonplace amongst land use planners according to an insightful new book by Alain Bertaud, a notable urban planner with extensive global experience:
I have found that many urban planners, even in the very affluent cities of Western Europe, North America, and East Asia, not only seldom understand how markets work, but are proud to pretend to ignore them.1
We agree with Bertaud. In fact, the reason the Centre for Urban Research and Land Development was established at Toronto Metropolitan University was to encourage economic analysis in the use of the formulation of urban policy decisions within the Greater Golden Horseshoe. Through research, seminars and education initiatives, our mission is to inform urban decision makers, the public and students on the importance of economics and real estate market understanding in formulating effective land use policies and minimizing unintentional adverse economic impacts.
The basic rules of supply and demand often used in economic discussion can help illustrate how policies such as Bill 108 will help improve affordability, both in theory and in practice.
The impact of increased supply on housing prices in theory
A recent academic report from the NYU Furman Centre (the New York City version of CUR) highlighted that housing markets follow the laws of supply and demand, even when land is constrained.2
The rules of supply and demand can help us understand the directional impact of Bill 108.3 Its result will be to reduce the costs of producing new homes, which will reduce housing prices, assuming all else is equal.
Figure 1 shows a supply and demand curve, a visualization of how much housing will be supplied and demanded at various price levels (the same analysis applies to rents). How much housing (Quantity) can be interpreted as the number of units, or the square footage of housing.
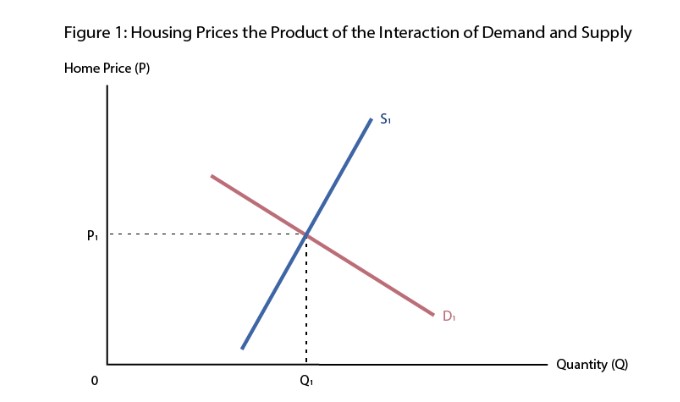
The downward slowing demand curve (labeled D) tells us that as home prices go up, households will demand less housing, and that the trend reverses when prices decline. As prices fall, households can afford more housing, and therefore will buy more.
The upward slope of the supply curve tells us that as home prices go up, developers will build more housing. Conversely, as home prices go down, the market will produce less housing. Reductions in the costs of production allow firms to build more housing at every price level, thereby shifting the supply curve to the right. Factors that can shift the supply curve right and/or make the curve flatter (more price elastic) include the designation of more sites for development, faster approvals, lower development costs, and technological improvements in building or land servicing.
The equilibrium price is determined by the intersection of the demand and supply curves. Market forces (as described by Adam Smith’s 'invisible hand'4) will equalize the quantity supplied and demanded (Q1) at the equilibrium price (P1), over the long-run in a competitive market.
The slope of each curve reflects the magnitude of changes in demand and supply for every change in home prices. The housing supply curve is typically much steeper than the demand curve, which means that a given change in home prices results in very little change in housing supplied, or price elasticity in economic jargon. Flatter curves imply larger changes in quantity supplied and demanded, resulting in smaller changes in home prices.
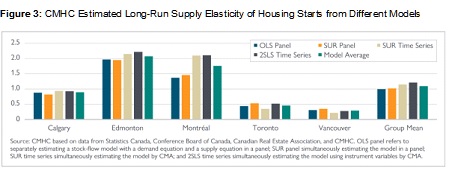
As we shall see, the Canadian Mortgage and Housing Corporation (CMHC) demonstrated that the price elasticity of new housing supply in the GTA as well as in Metro Vancouver is quite low compared to other larger metropolitan regions in Canada.
Policies that increase land supply, reduce cost and uncertainty and enhance development efficiencies can have two effects on supply:
- An increase in how much housing can be built at every price point, thereby shifting the supply curve to the right, as seen in Figure 2. Under this scenario, the new supply curve becomes S2, the equilibrium price of housing falls from P1 to P2 and the amount of housing built rises from Q1 to Q2. Absent a demand shock, more housing is built at lower prices when production costs fall.
- An increase in the responsiveness of supply to price changes by reducing the slope of the supply curve - making the supply curve more elastic (see Figure 2). More housing will be provided per unit relative to a change in housing prices.
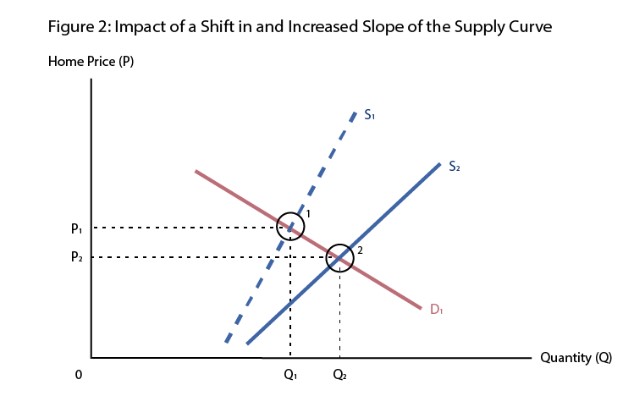
The theory is unequivocal – the directional impact of Bill 108 is for lower housing prices (and rents) in a competitive market.
The impact of regulation on the supply-demand curves in practice
A study done by the Australian Central Bank used the laws of supply and demand to illustrate the impact of zoning on home prices in Sydney. This report found that zoning artificially restricted the supply of housing at below equilibrium levels. This resulted in the price of housing being significantly higher than would be the case if the market were operating at equilibrium. The “zoning effect”, as it was called, meant that households were paying $1.16 million (Australian currency) for an average priced home, instead of $671,000 – the price that would prevail if the market were left on its own.5
This effect can also be seen in Canada. In a milestone report, CMHC found that the supply curve for housing in the Toronto market is very inelastic. Looking at how the housing supply response to price pressures in five metropolitan areas studied, CMHC found that housing starts (the key measure of new supply) in Montreal, Calgary and Edmonton rise from about 1% to 2% for every 1% increase in home prices. However, for every 1% change in home prices in the Greater Toronto and Vancouver areas, housing starts only grow by 0.5% and 0.3%, respectively.6 It should come as no surprise that the more price inelastic markets are also the most expensive markets in Canada.
The supply constraints, however, are more pronounced in markets tied to ground-related housing. CMHC mentioned that supply responded far more strongly in the apartment market than for any other housing type in the GTA during the period. This contrasts to their findings that demand was strongest for ground-related housing.
Some of the supply constraints in the GTA can be attributed to geography, for example, such as Toronto’s position adjacent to Lake Ontario. There is really not much we can do about that. However, CMHC pointed out that there could be options for revitalizing the current housing stock to create more density. The report also linked the rise in home prices since the early 2000s to regulatory red tape, such as long time frames for planning and zoning approvals and building permits.
While CMHC only examined supply elasticities across five Canadian cities, research has also shown that Canada overall ranks low compared to other countries in regards to the regulatory burden in the building permit system. The 2018 World Bank report “Doing Business” ranked Canada 54th out of 190 among OECD countries for ease of obtaining a construction permit.7
Bill 108 and the provincial government’s Housing Supply Action Plan are designed to raise the responsiveness of new housing supply relative to demand, which in turn, will moderate home price increases in the future.
The impact of increased housing supply on prices in the GTA in practice
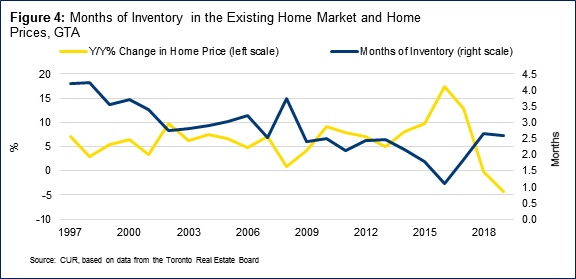
In practice, the research confirms that the housing market follows the laws of supply and demand. The number of homes for sale (supply) relative to the number of homes sold (demand), drives home prices in the resale market. One measure of the interaction between supply and demand is months of inventory on the market – the number of months it would take to work down all active listings currently on the market. When months of inventory falls, sales are rising faster than the number of active listings. The market is tightening, meaning price pressures rise. When months of inventory rise, the opposite is true. The market is likely loosening, and price growth moderates.
See Figure 4 for the relationship between prices and inventory in the GTA over the last 25 years.8
A significant way to increase the number of active listings is to increase new home construction, which:
- increases the total stock of housing; and
- gives residents of the current stock the opportunity to move up or down, thus making their current home available to others.
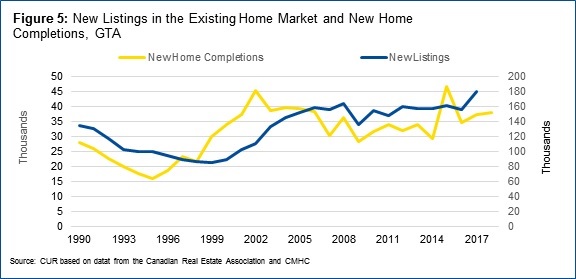
Figure 5 shows the general relationship between new listings and completions (all unit types). The quantity of new listings moves in the same direction as housing completions, with an expected lag.
Conclusion
The challenge in Ontario over the last decade (or more) has been keeping up with demand pressures (such as the entry of the Millennials into the housing market, immigration, low interest rates and foreign investment) that have shifted the demand curve for housing further right, thus driving home prices higher.
Population growth in Ontario’s major CMAs accelerated over the 2016 to 2018 period. The population of the Greater Golden Horseshoe rose by an average of 160,000 people per year between 2016 and 2018, up from 100,000 per year between 2011 and 2016. Housing this growing population will continue to be a challenge for the region.
Policies like Bill 108 aim to make the development industry more nimble so that supply can better keep pace with demand, thus countering the impact of demand forces on prices. The research and statistical evidence suggests that the housing market follows the laws of supply and demand relatively closely. As such, one way to address affordability challenges is to remove red tape and costs to allow supply to be more responsive to demand.
Bill 108 will not be a panacea for Ontario’s affordability challenges, but it is a step in the right direction.
Sources:
[1] Bertaud Alain (2018). Order without Design: How Markets Shape Cities. Cambridge: The MIT Press, 17.
[2] Been, Vicki, Ingrid Gould, and Ellen Katherine O’Regan (2017). Supply Skepticism: Housing Supply and Affordability. New York: NYU Furman Center, NYU Wagner School and NYU School of Law.
[3] For a textbook discussion of supply and demand curves and price determination see: Harrison, A.J. (1977). Economics and Land Use Planning, Croom Helm Ltd. 35-39. See also Amborski, David (2015). Basic Concepts in Understanding Housing and Land Markets. Centre of Urban Research and Land Development. [Online] Available at https://www.torontomu.ca/cur/news_events/event_june1/
[4] Smith, Adam (1776). The Wealth of Nations.
[5] Kendell, Ross and Peter Tulip (2018). The Effect of Zoning on House Prices. Sydney: Economic Research Department, Reserve Bank of Australia.
[6] Canadian Mortgage and Housing Corporation (2018). Examining Escalating House Prices in Large Canadian Metropolitan Centres. [Online] Available https://www.cmhc-schl.gc.ca/en/data-and-research/publications-and-reports/examining-escalating-house-prices-in-large-canadian-metropolitan-centres (external link) , 7.
[7] Amborski, David (external link) (2019). Opportunities for Innovation in Construction Permitting Across Canada, Centre for Urban Research and Land Development, publication forthcoming.
[8] The MLS data series examined here includes all types of housing sold by unit type and tenure.
_____________________________________________________________________
Frank Clayton is Senior Research Fellow at Toronto Metropolitan University’s Centre for Urban Research and Land Development (CUR) in Toronto.
Diana Petramala is Senior Researcher at Toronto Metropolitan University's Centre for Urban Research and Land Development (CUR) in Toronto.
_________________________________________________________________________________________________________