GGH’s Greater Population Growth in 2022 Compared to 2019 Centred in the City of Toronto and Waterloo Region
By: Frank Clayton and Nigel Alphonso, TMU CUR
January 19, 2023
(PDF file) Print-friendly version available
Summary
Statistics Canada released its annual population estimates for subprovincial areas as of July 1, 2022.1 The estimates for census divisions (CDs) and census metropolitan areas (CMAs) are reviewed here. Census Divisions include single-tier municipalities (Toronto, Hamilton), regional municipalities (e.g., Peel, Halton) and counties, including separated municipalities (the Simcoe County CD incorporates the population of Barrie and Orillia, for example). The latest population figures are subject to revision.
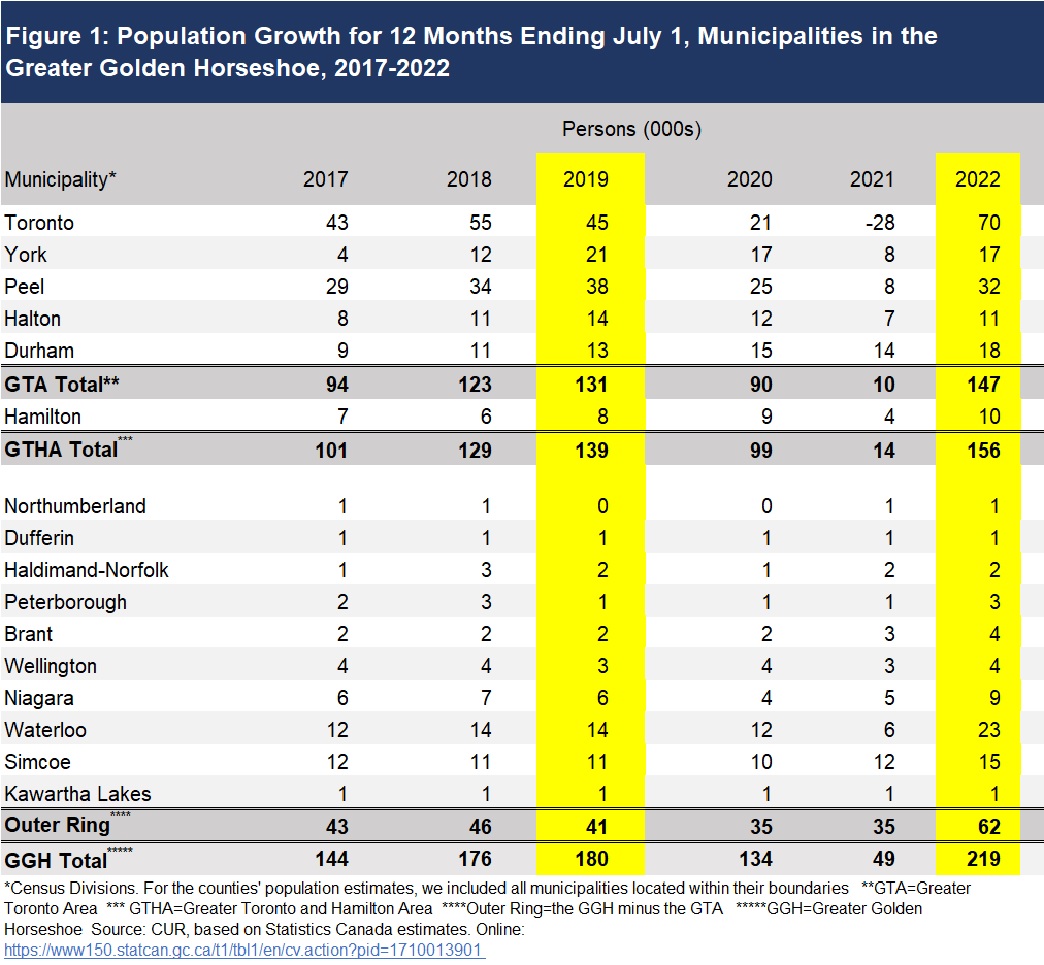
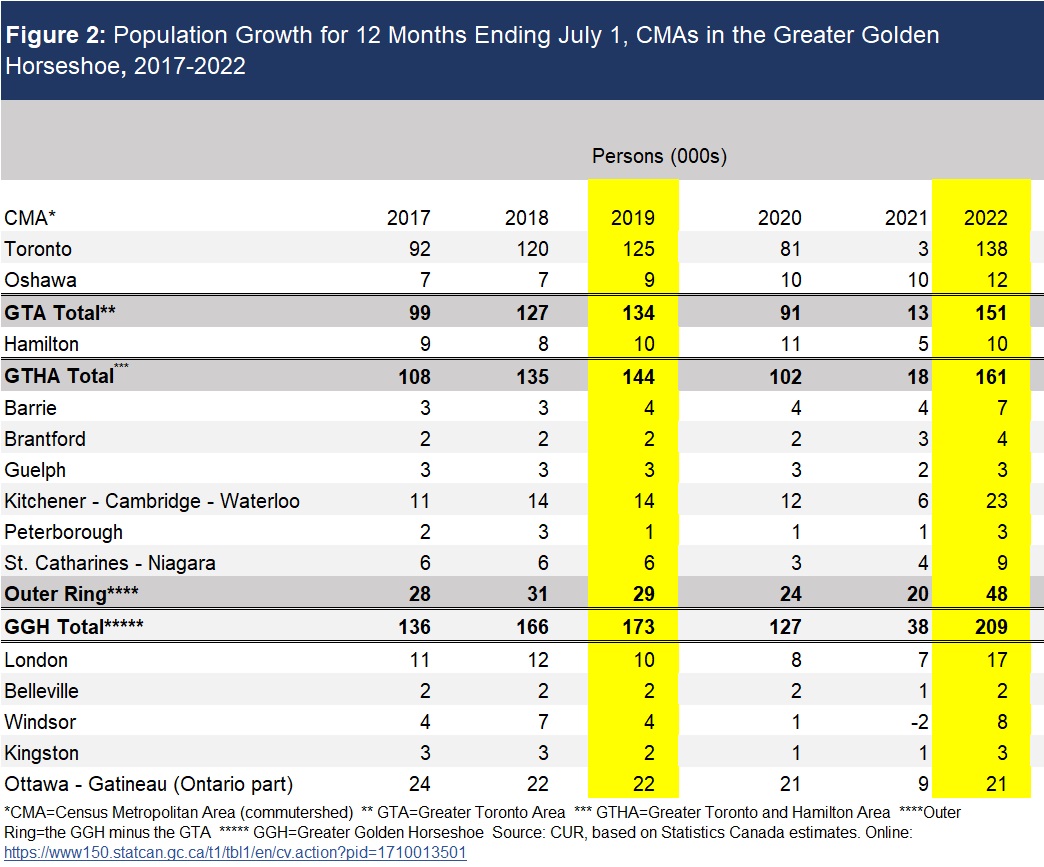
Two tables are included. Table 1 contains population change for the latest six years by census division (municipality) within the Greater Golden Horseshoe (GGH) with subtotals for the Greater Toronto Area, the Greater Toronto and Hamilton Area, and the Outer Ring (GGH outside the GTHA). Table 2 contains the annual population estimates for census metropolitan areas (CMAs). CMAs are commuter sheds representing housing market areas.
GGH population growth surged in the 12 months ending July 1, 2022, from the pandemic-inspired drop in the previous 12 months, largely due to a sharp increase in immigration. However, instead of detailing population growth in 2022 with 2021, this review opts to compare population growth for the 12 months ending July 1, 2022, to the change in the 12 months ending July 1, 2019. 2019 was the latest 12 months before the pandemic negatively impacted the economy, including migration levels.
Nearly 90% of the acceleration of GGH population growth between 2019 and 2022 in the city of Toronto and Waterloo region (Figure 1)
The GGH’s population growth increased by 219,000 in 2022 compared to an increase of 180,000 in 2019, an addition of 39,000 persons. Two municipalities accounted for 87% of this growth:
- The city of Toronto: Population growth climbed to 70,000 in 2022 from 45,000 in 2019 or 25,000 persons; and
- Waterloo region: Population growth rose from 14,000 in 2019 to 23,000 in 2022 or 9,000 persons.
The GTA’s share of GGH growth fell in 2022 to 67% from 73% in 2019.
Most CMAs experienced incremental population growth in 2022 from 2019 including:
- Durham region: increased 13,000 in 2019 compared to 18,000 in 2022, a growth of 5,000 persons; and
- Simcoe county: increased 11,000 in 2019 compared to 15,000 in 2022, a growth of 4,000.
Toronto and Kitchener-Cambridge-Waterloo CMAs attract 62% of the incremental growth in the nine CMAs within the GGH between 2019 and 2022 (Figure 2)
In contrast with the municipal analysis, when we examine housing market areas (CMAs), Toronto and Kitchener-Cambridge-Waterloo accounted for a lesser share of GGH population growth – 62% vs. 87%. The CMA share is lower due to the population growth in York, Peel and Halton regions being less in 2022 than in 2019.
Population growth in the nine CMAs within the GGH increased by 209,000 in 2022 from an increase of 173,000 in 2019, a growth of 36,000 persons. Two CMAs accounted for 62% of this growth:
- The Toronto CMA: Population growth climbed to 138,000 in 2022 from 125,000 in 2019 or 13,000 persons; and
- The Kitchener-Cambridge-Waterloo CMA: Population growth rose from 14,000 in 2019 to 23,000 in 2022 or 9,000 persons.
The two CMAs in the GTA (Toronto and Oshawa) share of nine CMAs in the GGH growth fell in 2022 to 72% from 77% in 2019.
Several municipalities experienced incremental population growth of 3,000 persons in 2022 from 2019:
- Oshawa CMA: from 9,000 in 2019 to 12,000 in 2022;
- Barrie CMA: from 4,000 in 2019 to 7,000 in 2022; and
- St. Catharines-Niagara from 6,000 in 2019 to 9,000 in 2022.
The Hamilton and Guelph CMAs recorded the same growth in 2022 as in 2019 – 10,000 and 3,000 persons, respectively.
The figure also includes five Ontario CMAs outside the GGH. The London CMA’s growth was robust, increasing from 10,000 persons in 2019 to 17,000 in 2022.
Footnotes
[1] The population estimates released by Statistics Canada are for July 1st. We refer to the 12 months ending July by its calendar year, e.g., growth in the 12 months ending July 1, 2022, is labelled 2022.
Frank Clayton, Ph.D., is Senior Research Fellow at Toronto Metropolitan University’s Centre for Urban Research and Land Development (CUR) in Toronto.
Nigel Alphonso, is Research Assistant at Toronto Metropolitan University’s Centre for Urban Research and Land Development (CUR) in Toronto.