Toronto Second Fastest Growing Metropolitan Area, City of Toronto the Fastest Growing Central City, in the United States/Canada in 2022
By: Frank Clayton and Nigel Alphonso, TMU CUR
May 23, 2023
(PDF file) Print-friendly version available (opens in new window)
Background
This blog compares population growth in metropolitan areas and major central cities in Canada in 2022 with those south of the border. Population growth is based on population estimates prepared by the U.S. Census Bureau and Statistics Canada as of July 1, 2021, and July 1, 2022.1 For brevity, the full names of several metropolitan areas are shortened in the text.
In absolute numbers, Toronto was the second fastest-growing metropolitan area in 2022, surpassed only by Dallas – Vancouver was fifth in the ranking
Metropolitan Dallas was the top metropolitan area in terms of population growth in 2022, with an increase of 170,396 persons, 32,156 persons more than Toronto’s 138,240 persons (see Figure 1).
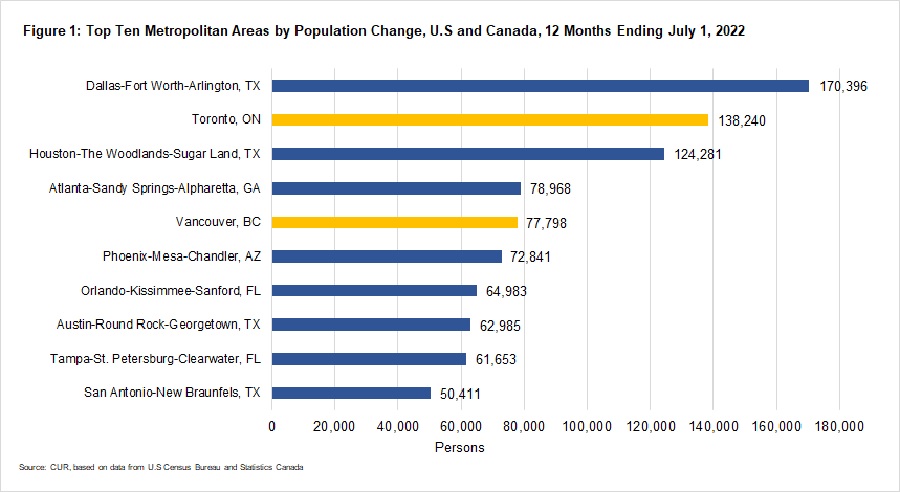
One other Canadian metropolitan area made the top ten list regarding population growth – Vancouver, with an increase of 77,798 persons. Calgary was 11th at 49,754 persons.
In contrast with the United States, none of Canada’s 41 metropolitan areas had population declines in 2022 – U.S. declines were largest in New York, Los Angeles, Chicago, and San Francisco
All large metropolitan areas recording population declines in the 12 months ending July 1, 2022, were in the United States (see Figure 2).
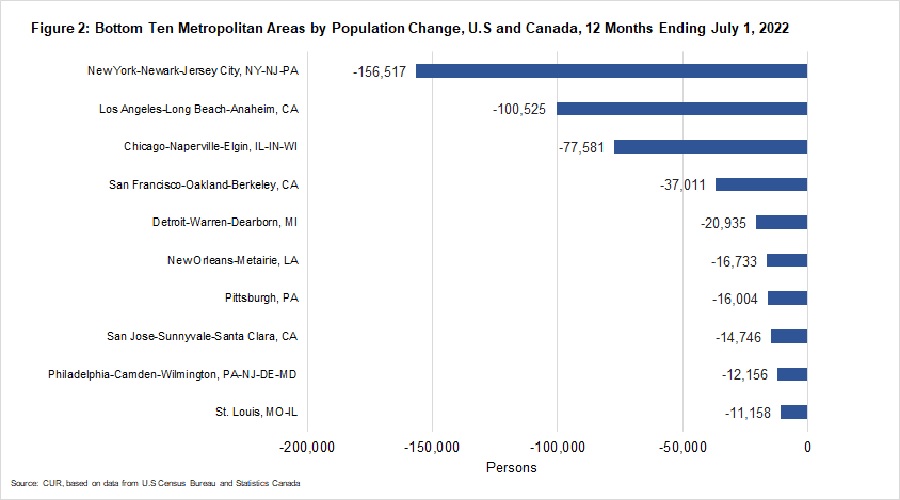
The four U.S. metropolitan areas experiencing the largest declines in 2022 were the same as in 2021, though the size of the reductions was less in 2022: New York (-156,517 persons), Los Angeles (-100,525 persons), Chicago (-77,581 persons) and San Francisco (-37,011 persons).
The City of Toronto was the top central city in 2022 population growth – five of the top ten growing central cities were in Canada
Toronto’s population increase of 69,786 persons surpassed the fastest-growing U.S. central city, Fort Worth, which had a growth of 19,170 persons (see Figure 3).
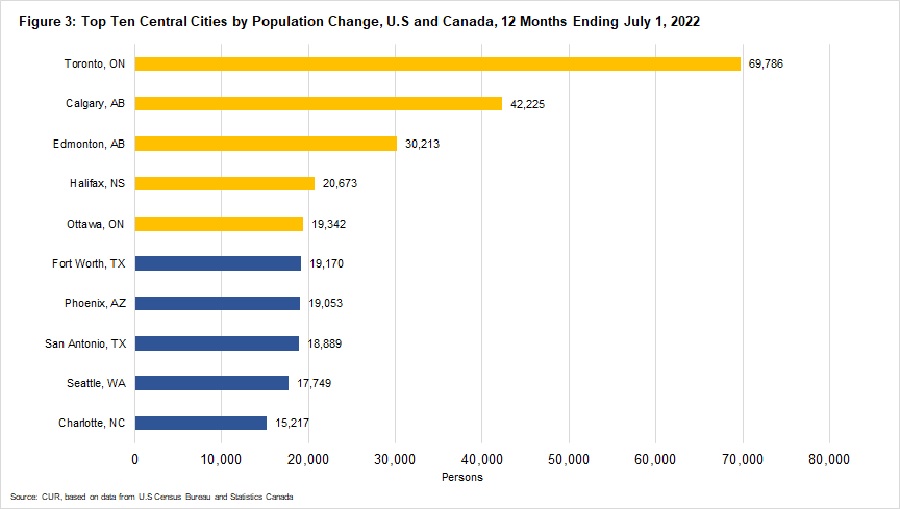
Calgary (42,225 persons), Edmonton (30,213 persons), Halifax (20,673) and Ottawa (19,342) were the other four Canadian central cities in the top ten.
All ten central cities with the largest declines were in the United States, with New York, Chicago, Philadelphia, and Los Angeles topping the decliners
The central city recording the most population loss was New York. Its population fell by an estimated 123,104 persons in the 12 months ending July 1, 2022 (see Figure 4).
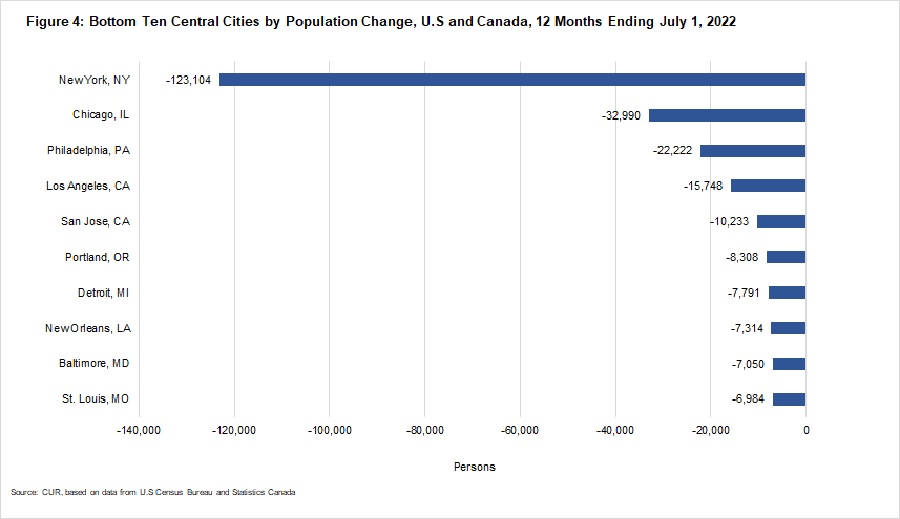
Other central U.S. cities with sizeable absolute declines in population include Chicago (-32,990 persons), Philadelphia (-22,222 persons), and Los Angeles (-15,748 persons).
General Observation
There is a fundamental difference in the sources of growth for most of the fastest-growing metropolitan areas in the two countries. Net immigration plays a much more significant role in urban population growth in Canada than in the United States. On the other hand, net internal migration is more prominent in the U.S.
Also, the resurgence of population growth in metropolitan Toronto and Vancouver adds to housing demand when the housing supply is already critically challenged.
Endnotes
1 The definition of metropolitan area is not the same in Canada and the United States. Generally, if the U.S. definition is applied to Canada, the total population and annual growth of its metropolitan areas would be higher than estimated. See the Appendix for brief descriptions. The Appendix also contains the source data links.
Data Sources
Canadian Census Metropolitan Area
Statistics Canada. (2023). Census Metropolitan Areas - Population estimates, July 1, by census metropolitan area and census agglomeration, 2016 boundaries. [Online] Available: https://www150.statcan.gc.ca/t1/tbl1/en/tv.action?pid=1710013501 (external link)
Census Divisions
Statistics Canada. (2023). Population estimates, July 1, by census subdivision, 2016 boundaries. [Online] Available: https://www150.statcan.gc.ca/t1/tbl1/en/tv.action?pid=1710014201 (external link)
U.S. Metropolitan Statistical Area
United States Census Bureau. (2022). Metropolitan and Micropolitan Statistical Areas Population Totals: 2020-2022. [Online] Available: https://www.census.gov/data/tables/time-series/demo/popest/2020s-total-metro-and-micro-statistical-areas.html (external link)
U.S. Cities Population Totals
United States Census Bureau. (2022). City and Town Population Totals: 2020-2022. [Online] Available: https://www.census.gov/data/tables/time-series/demo/popest/2020s-total-cities-and-towns.html (external link)
Appendix
Defining Canadian and U.S. Metropolitan Areas
A Canadian Census Metropolitan Area (CMA) consists of one or more adjacent municipalities centred on a population center (the core). A CMA must have a population of at least 100,000, of which 50,000 or more must live in the core. The adjacent areas to the urban core are included in the CMA if 50% of the resident population commutes into the core for work and 25% of the jobs are filled by commuters from the core or the municipality directly touches or is partly within the urban core.
A U.S. Metropolitan Statistical Area (MSA) includes a central county with at least 50% of its population living in an urban core with a population of 50,000 or more. Surrounding counties are included in the MSA if 25% of the resident population commutes into the central county(ies) for work and 25% of the jobs are filled by commuters from the central county(ies).
Because of the varying definition, U.S. MSAs tend to be larger in geography and population than Canadian CMAs.