Increases in Average Residential Property Taxes for Large Cities Within the Greater Toronto and Hamilton Area, 2016-2021
By: Frank Clayton and Brooke Adams, TMU CUR
August 22, 2023
(PDF file) Print-friendly version available
Background
This blog provides background on property taxes paid by homeowners (condominium and freehold) in eight large cities in the Greater Toronto and Hamilton Area (GTHA).1 Taxes levied on multi-family, rental, commercial, and industrial properties are outside the scope of this analysis. Utilizing custom tabulations from the 2021 Census of Canada, it updates a previous CUR study based on data from the 2016 Census of Canada.2 The blog also examines the changes in average property taxes paid between 2016 and 2021.3
Three aspects of property taxes are examined:
- Average property tax payment4;
- Average effective tax rate – property taxes as a percentage of the market value of the owner-occupied homes 5; and
- Average tax burden – property taxes as a percentage of homeowners' average household income.6
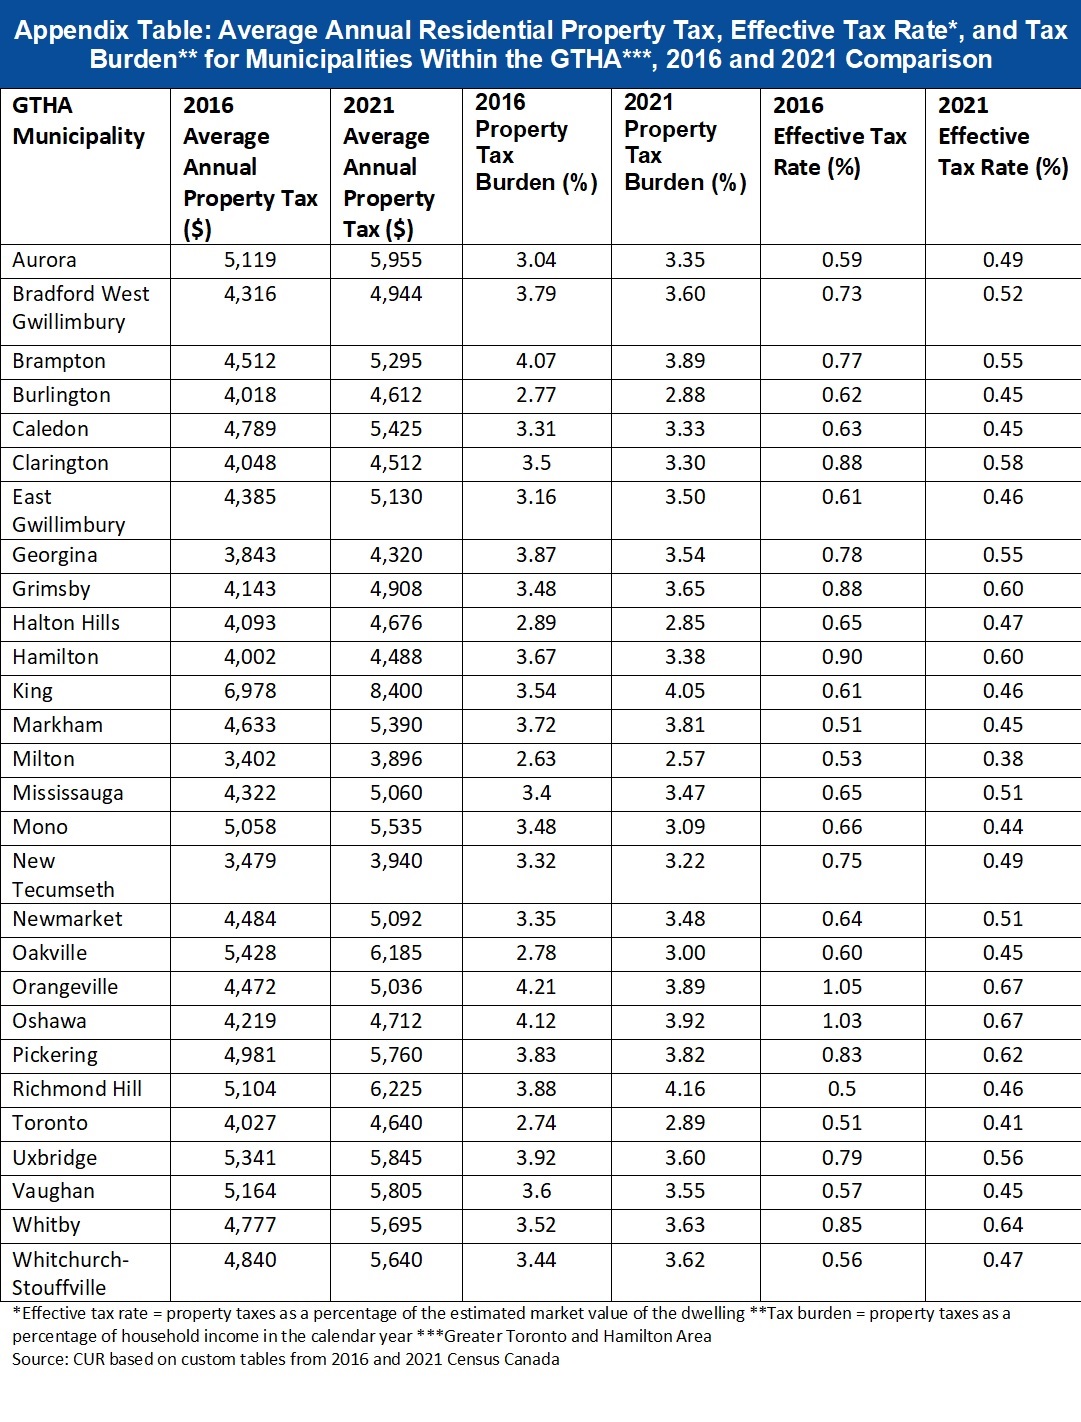
The eight larger cities within the GTHA are included: Toronto, Vaughan, Markham, Brampton, Mississauga, Oakville, Oshawa, and Hamilton. An appendix table contains the background data for all 29 municipalities within the GTHA. This is the second blog CUR has published utilizing custom data from the 2021 Census of Canada; the first blog is available here.7
Cities with lower effective residential property tax rates and tax burdens typically have the most room to increase their property tax revenues. The prime candidate for property tax increases is the city of Toronto, followed by the town of Oakville.
Ontario cities will remain financially constrained to the extent their assessment bases do not track rising property values, and they are not allowed to collect more revenues when a reassessment is undertaken. The rationale for reassessments has been to further equity between and within classes of properties, not to generate more tax revenue.
The inability of municipalities to generate more tax revenues when property values increase is in direct contrast with major tax sources of the two senior levels of government which automatically generate additional revenues when nominal incomes and retail spending increase.
Toronto has not only low property taxes but also a low increase between 2016 and 2021
Figure 1 shows the average residential property tax payments in eight large GTHA municipalities in 2016 and 2021 and the percentage change.8
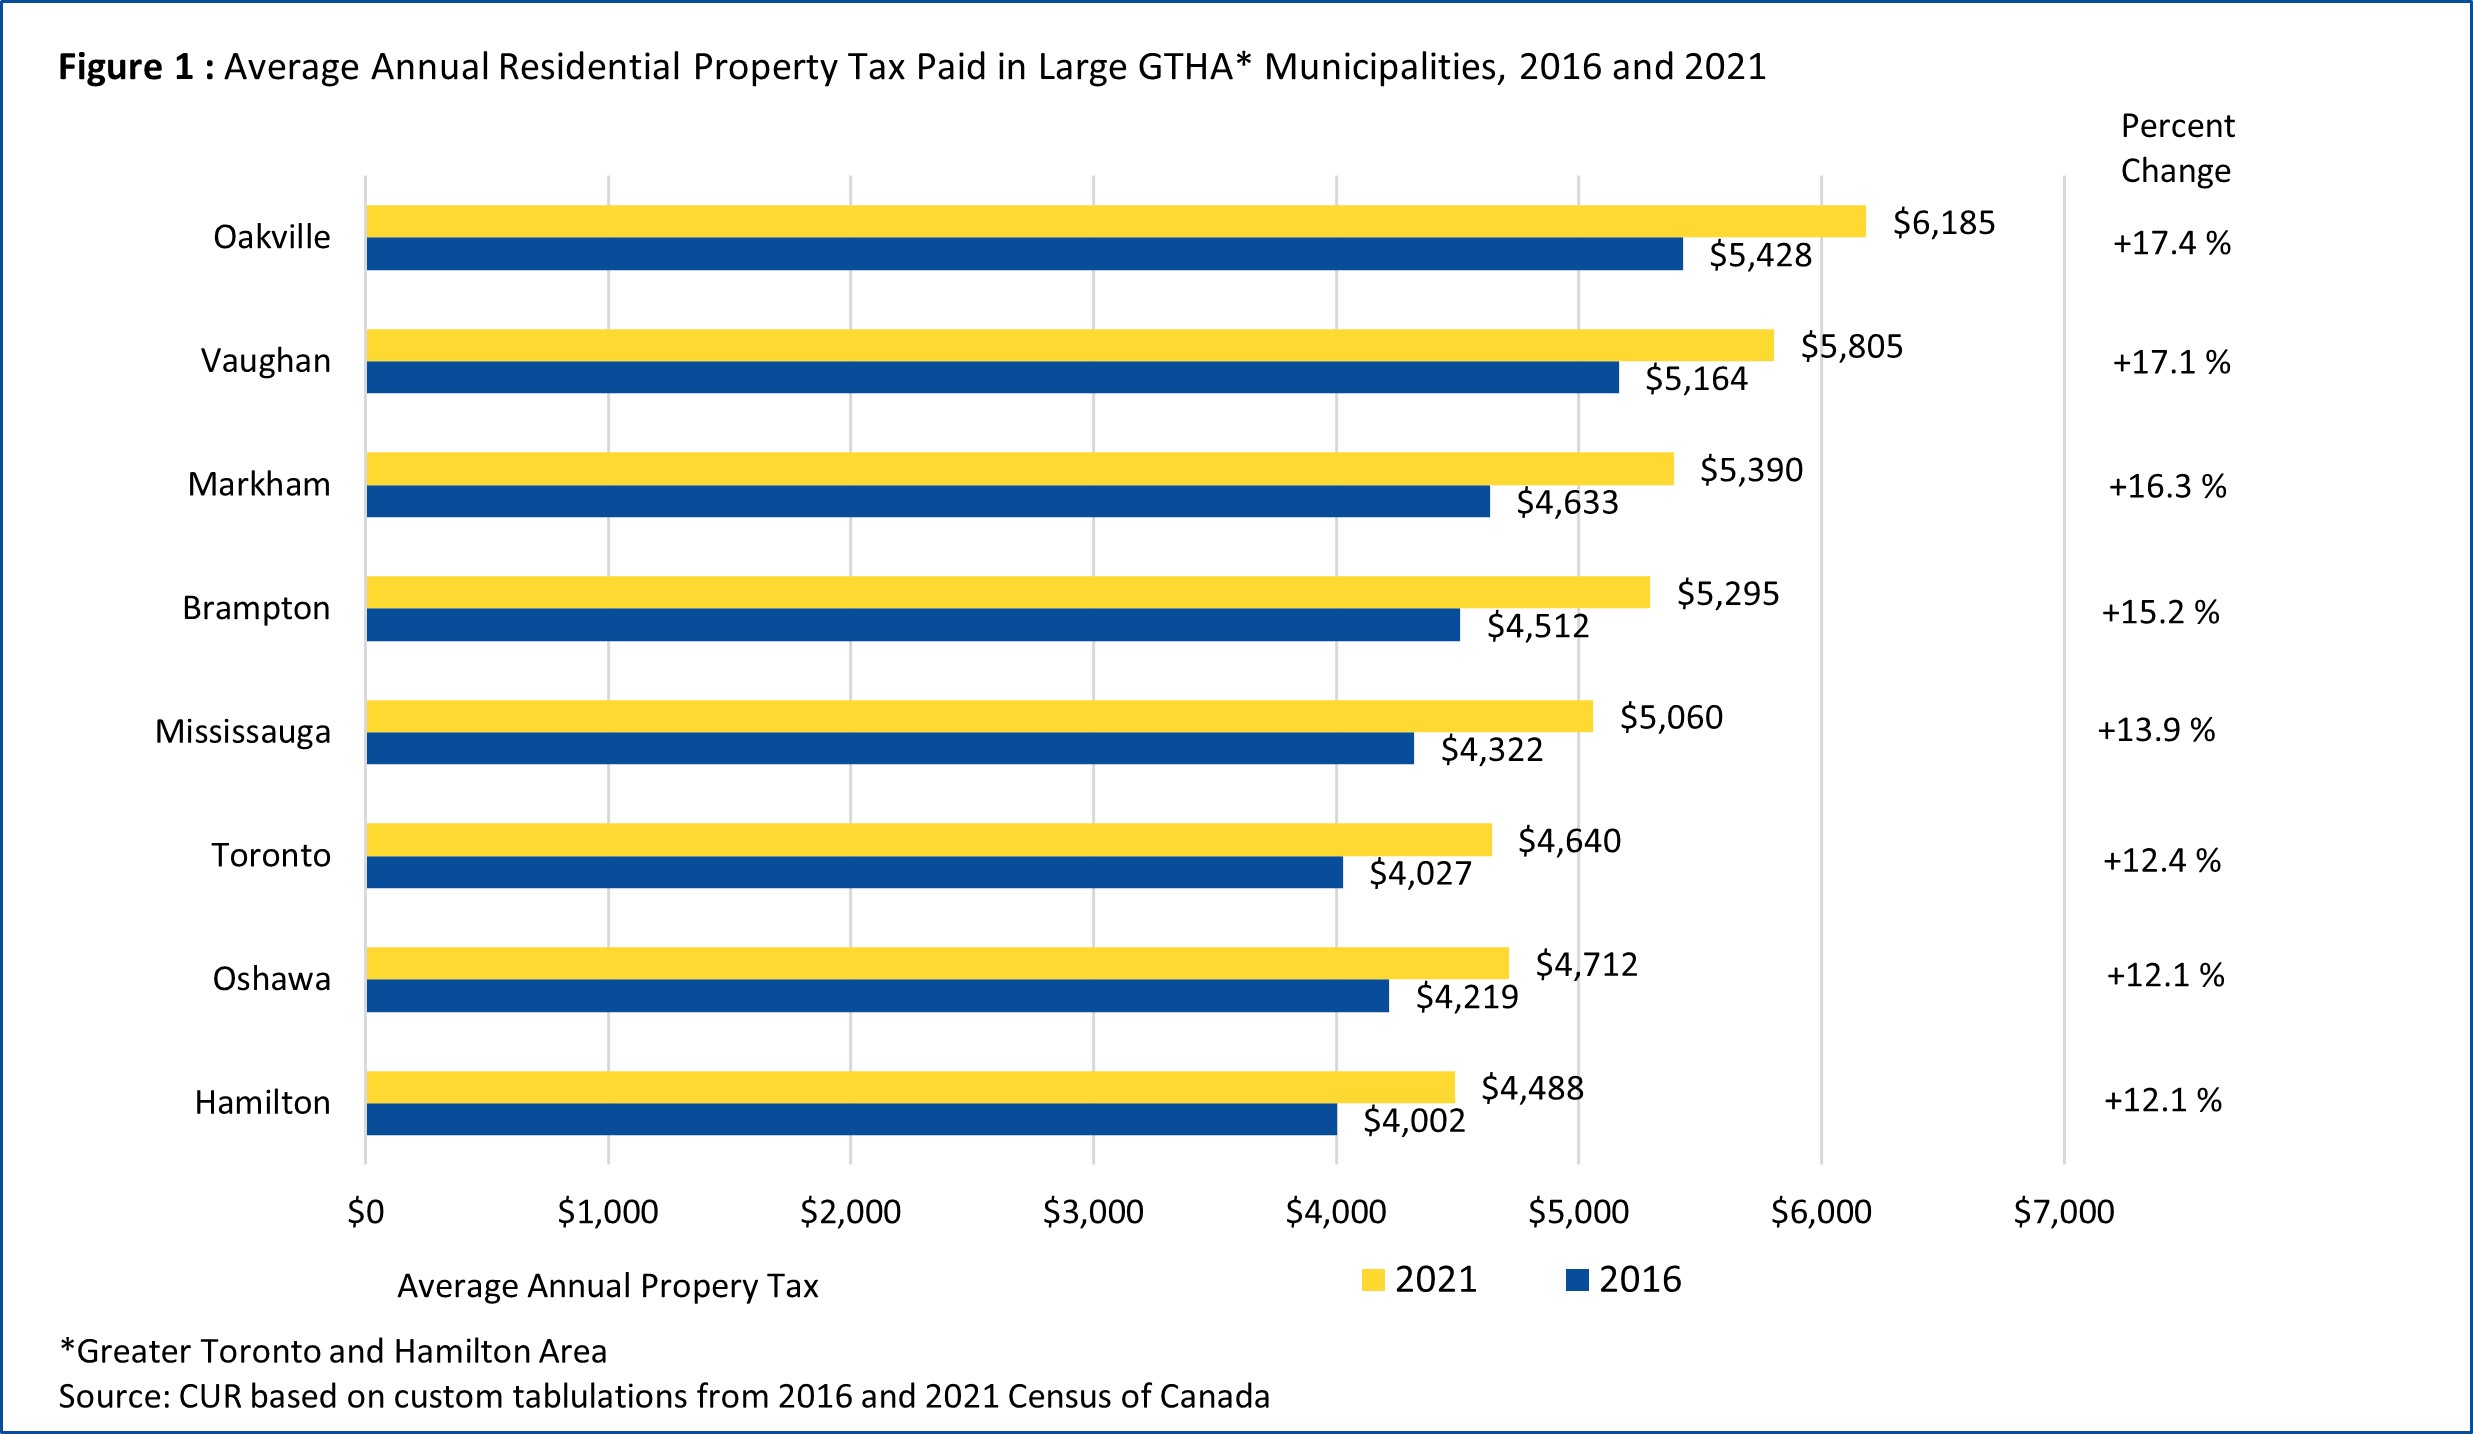
In 2021, Hamilton ($4,488) and Toronto ($4,640) had the lowest property taxes among the cities examined. Oakville ($6,185) and Vaughan ($5,805) had the largest average property taxes; average tax payments in Vaughan were 25% higher than Toronto's.
Hamilton, Oshawa, and Toronto had the smallest percent increase in average annual property taxes between 2016 and 2021, in the 12.1%-12.4% range. These increases are only slightly greater than the Ontario inflation rate of 10.3% for this period.9 Oakville and Vaughan had the highest average property tax payments in 2021 and the largest percent increases between 2016 and 2021 with a range of 17.1%-17.4%.
Marked decline in effective property tax rates between 2016 and 2021, with Toronto being the lowest
Figure 2 shows the effective tax rates (i.e., property tax payment as a percent of estimated home value) in eight large GTHA municipalities in 2016 and 2021 and the percentage change.
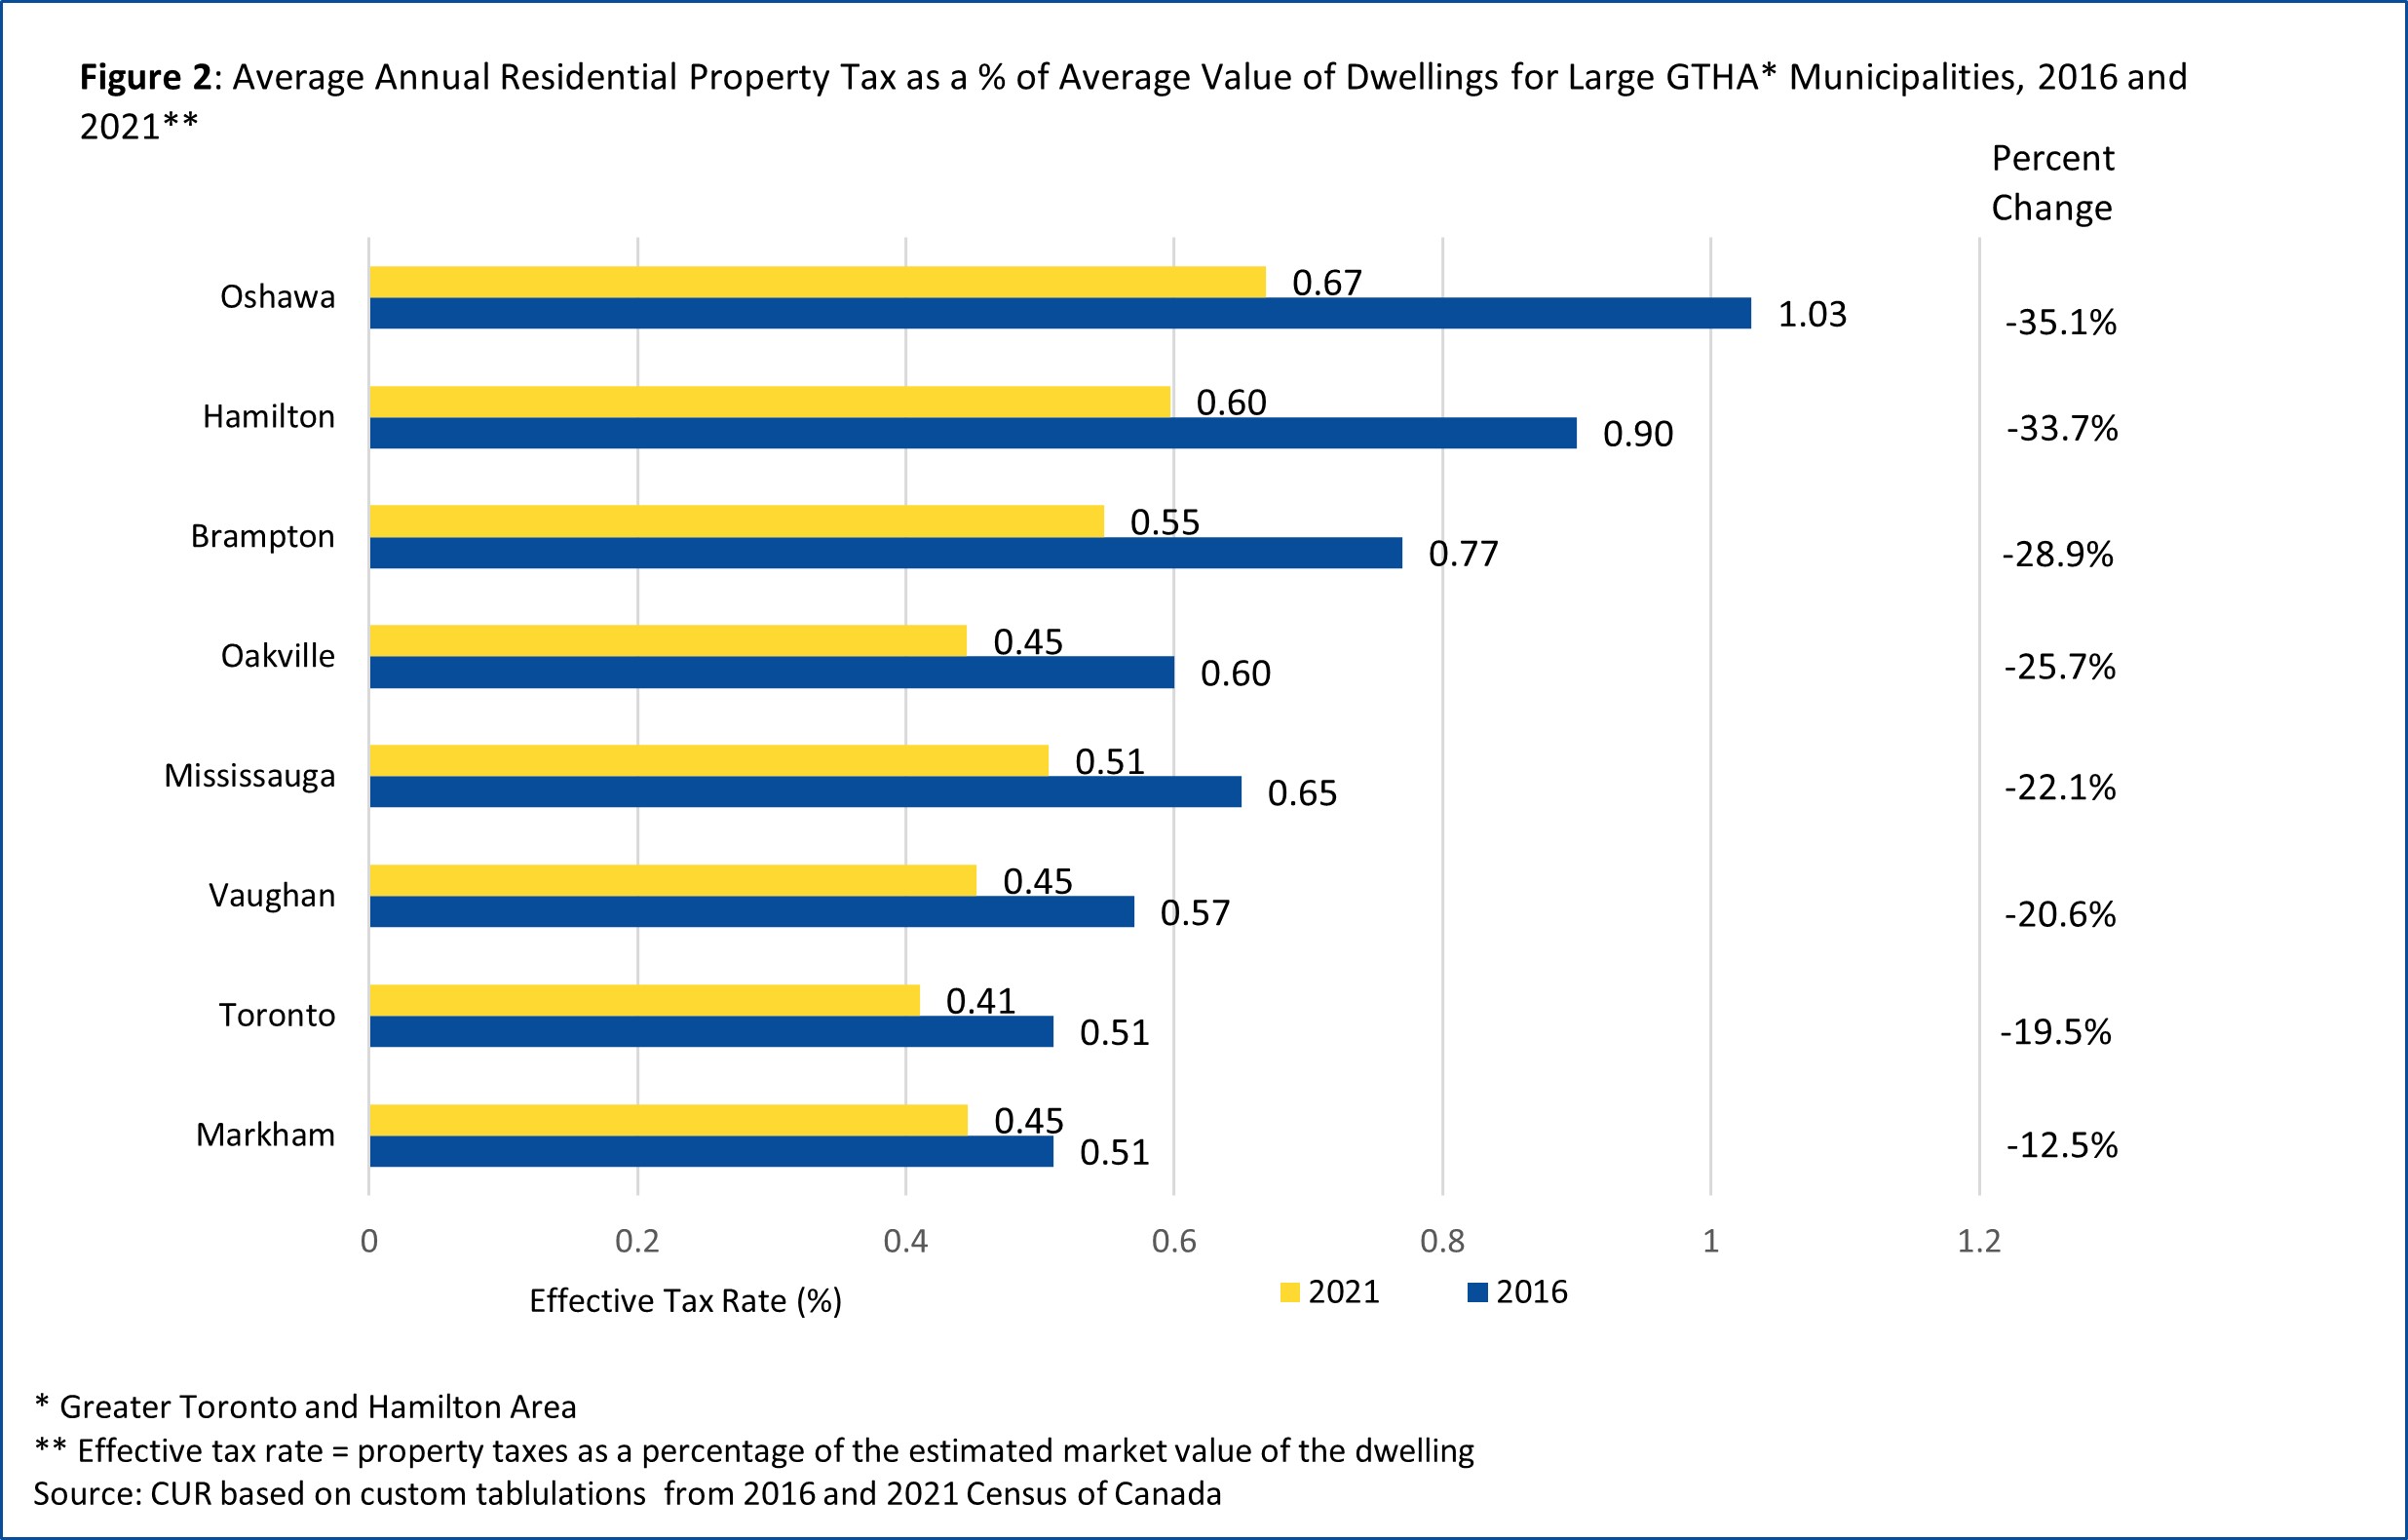
Toronto had the lowest effective property tax rate in 2021 at 0.41%, followed by Markham, Vaughan, and Oakville (all at 0.45%). Oshawa and Hamilton had the highest effective tax rates at 0.67% and 0.50%, respectively. These two cities also recorded the biggest decrease in effective tax rates between 2016 and 2021.
There are two reasons behind the sizeable declines in effective tax rates, even though nominal rates increased during the period:
- The market values of owner-occupied homes increased significantly between 2016 and 2021, whereas the assessed values did not change. The last reassessment of properties in the province was at a January 1, 2016, valuation date.
- However, even if the current values calculated by the assessors had been updated, effective tax rates would have declined.
At the time higher reassessed values are introduced, Ontario municipalities cannot generate increased tax revenues due to the reassessment. Consequently, the effective property tax rate must decline for most homes with each reassessment, assuming market values are increasing. Councils may only increase revenue by increasing the nominal property tax rate, which traditionally is undertaken as part of the annual budgeting process.
The property tax is unique in this regard. For example, when incomes or consumer spending increase, the senior governments automatically benefit from higher tax revenues since the effective tax rates are unchanged.
Average dwelling values increase the most in Oshawa, Hamilton, and Brampton and the least in Marham, Vaughan and Toronto
Figure 3 presents the average values of owner-occupied dwellings (freehold and condominium) for the eight cities in 2016 and 2021 and the percentage increase.
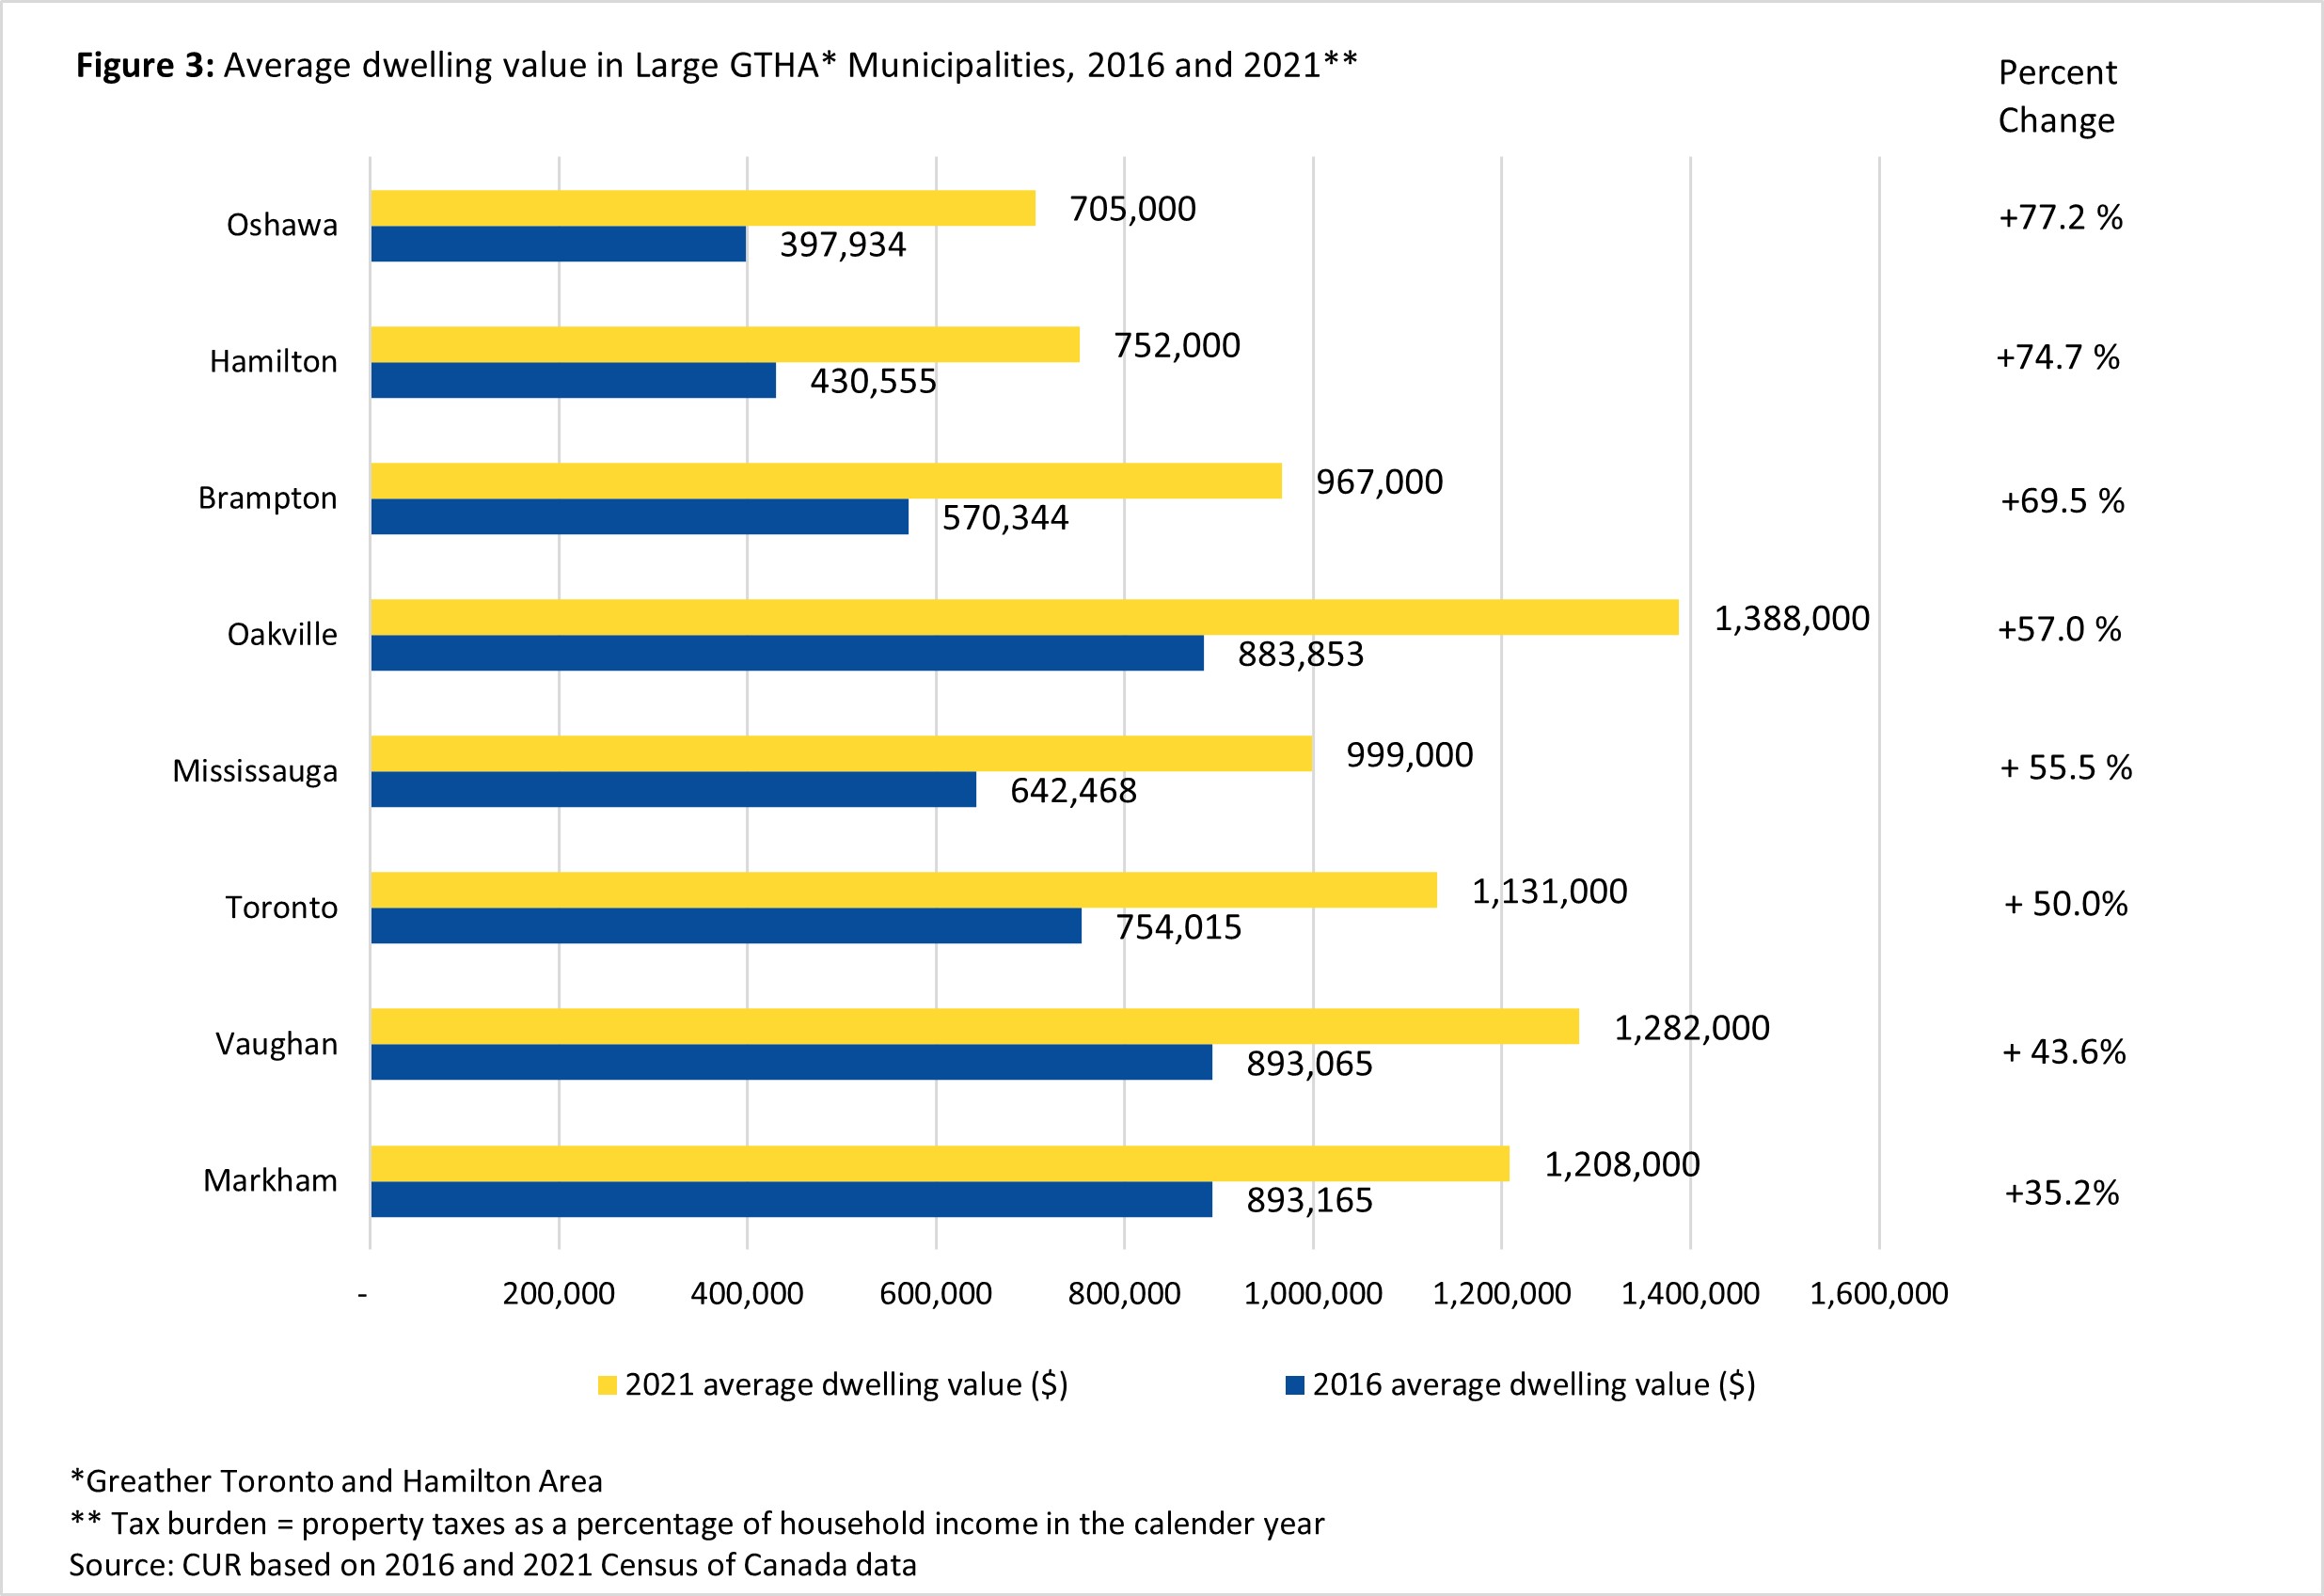
Average home values exploded between 2016 and 2021, with the most significant increases in the municipalities with the lowest average home values in 2016 – Oshawa (77.2% increase), Hamilton (74.5% increase), and Brampton (69.5% increase). Coincidentally, these municipalities also experienced the biggest declines in effective tax rates between these years.
At the other end, Markham, Vaughan, and Toronto had the smallest percent increases in the average value of owner-occupied dwellings and the smallest declines in effective tax rates.
Toronto and Oakville experienced modest increases in average property tax burdens between 2016 and 2021, though tax burdens remained lowest in these two cities
Table 4 shows the average residential property tax burden (property tax payments as a percent of average household income) for the eight cities considered for 2016 and 2021 and the percentage change.
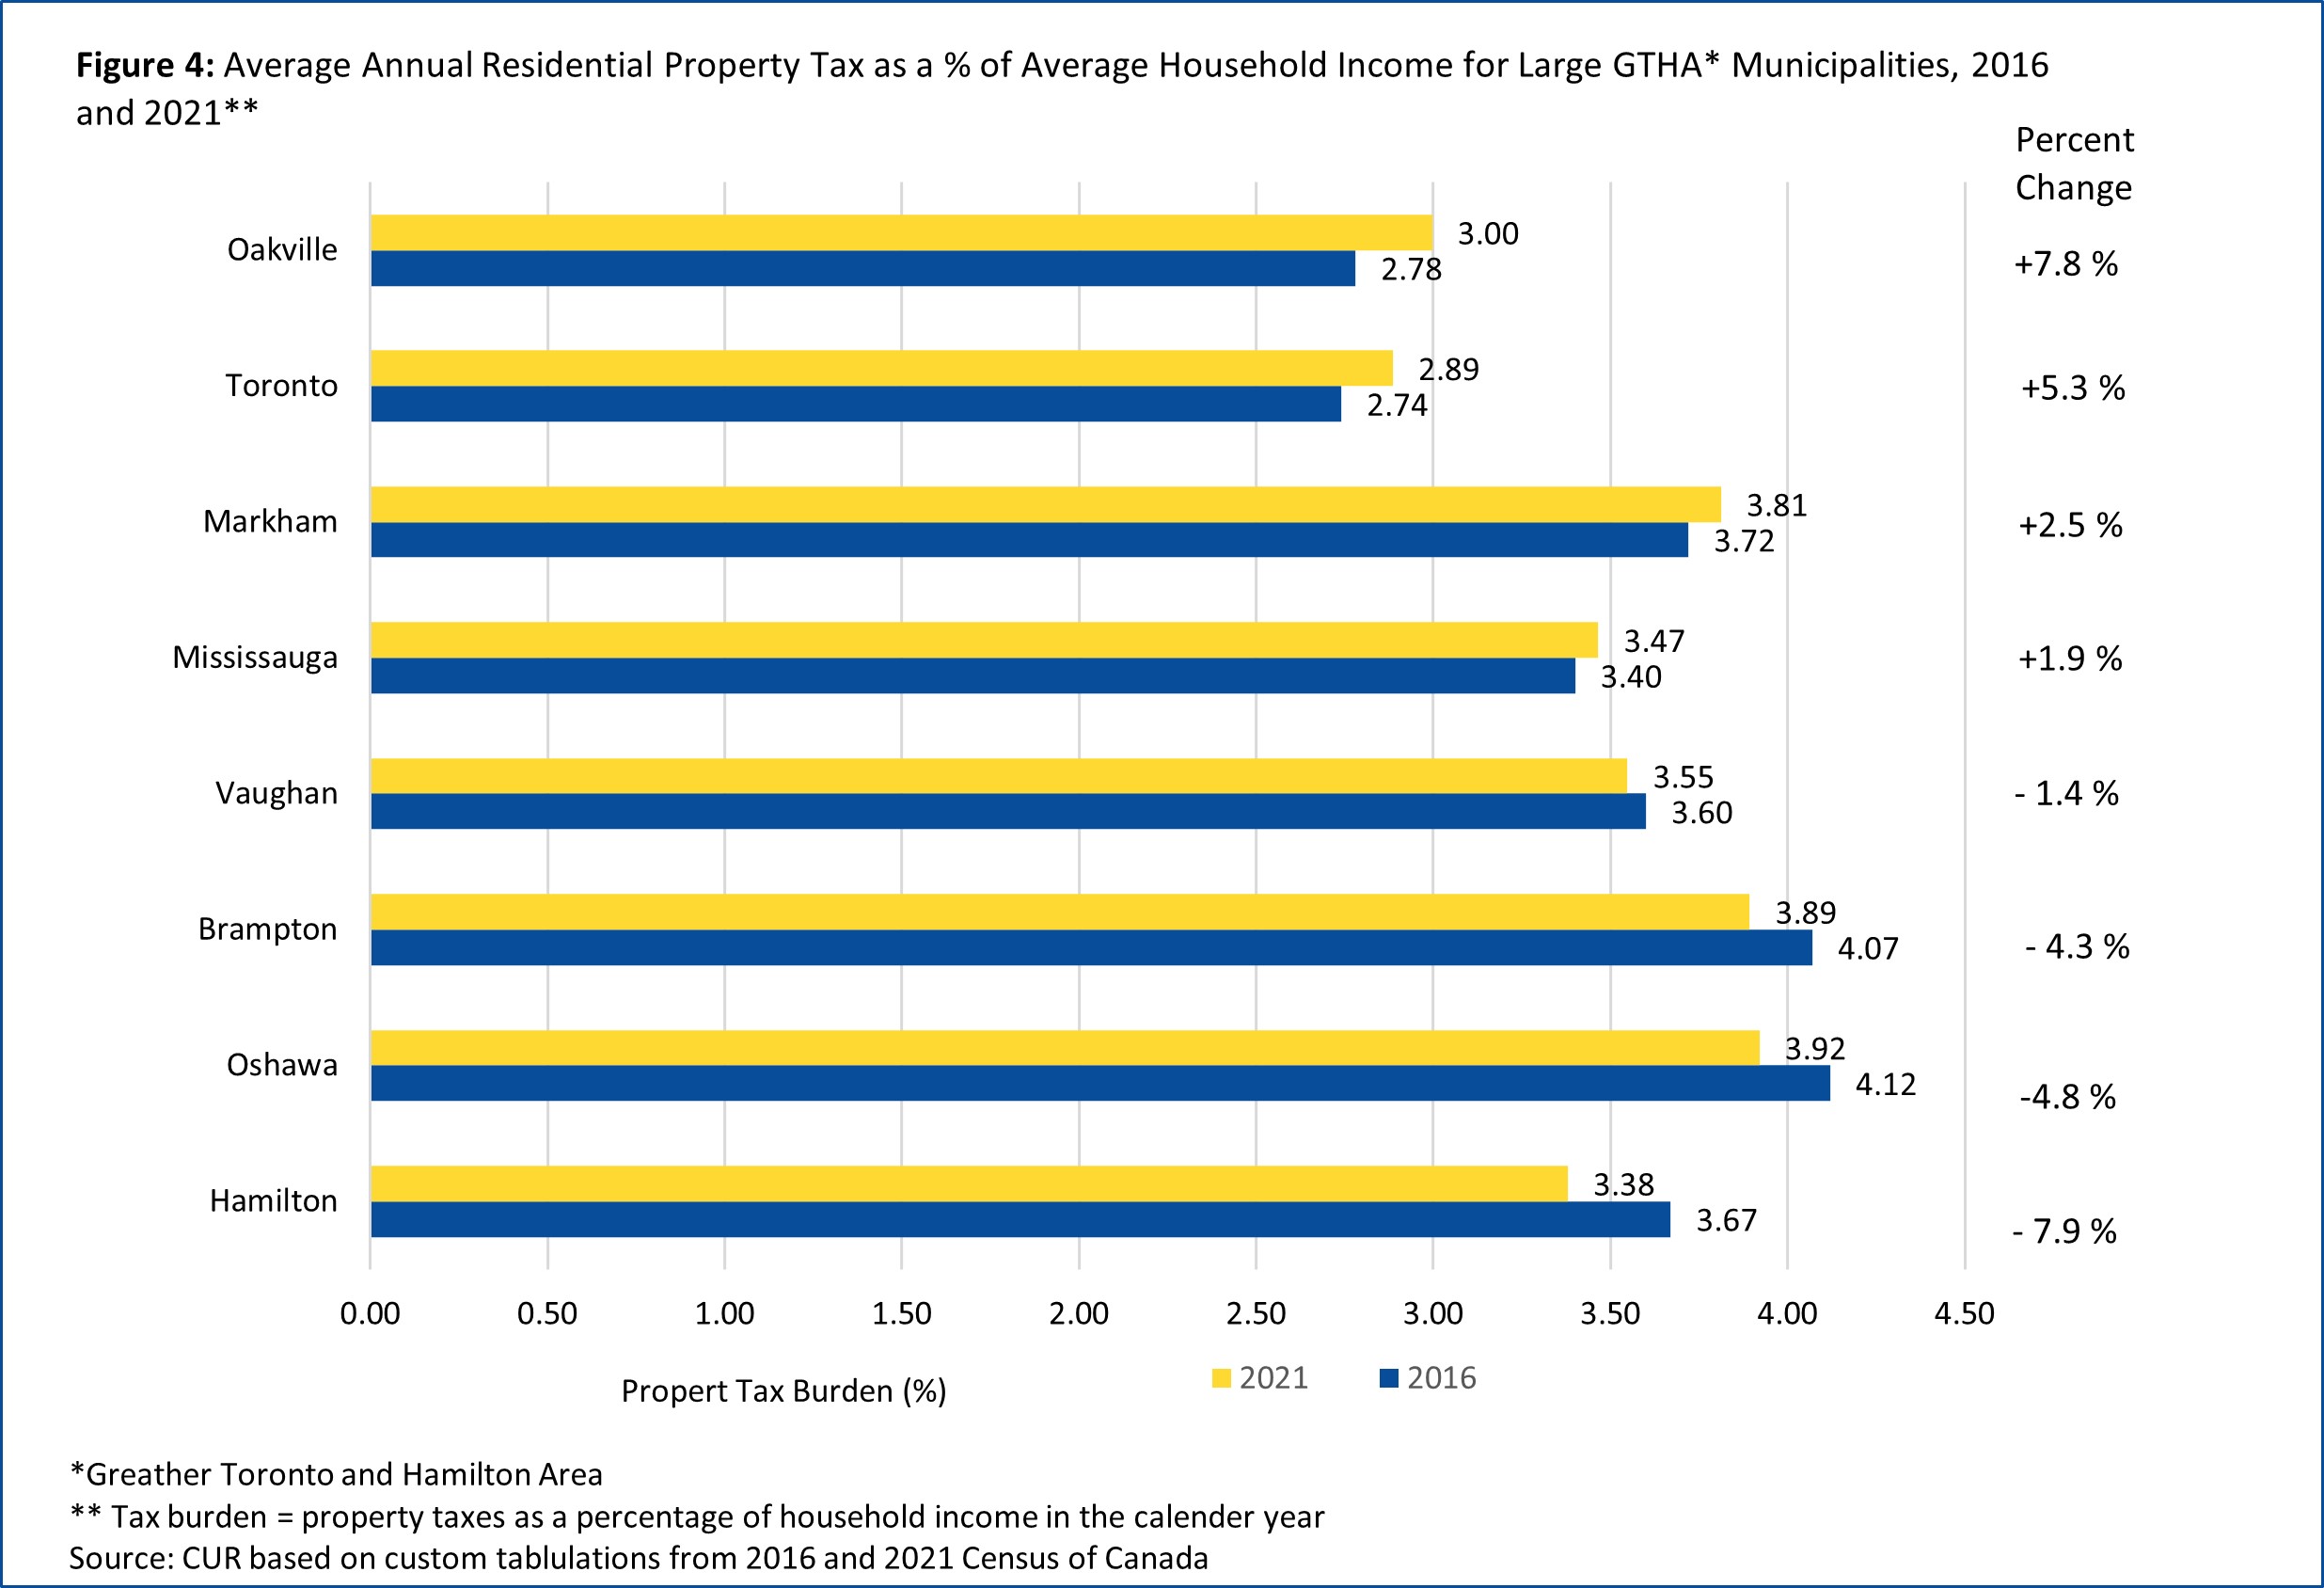
Four municipalities recorded modest increases, and four had modest declines in the average property tax burden. Oakville and Toronto had the largest increases, at 7.8 and 5.3%, respectively. Hamilton (-7.9%), Oshawa (-4.8%) and Brampton (-4.3%) had average household incomes rise more than average residential property taxes.
However, despite the small percentage increases between 2016 and 2021, Toronto and Oakville still recorded the lowest average property tax burden at 2.89% and 3.00%, respectively. At the other extreme, Hamilton (3.38%), Brampton (3.98%), and Oshawa (3.92%) had the highest average property tax burden.
Revenue implications if the 2016 effective tax rates were applied in 2021
Keeping the effective tax rate in 2021 unchanged from 2016 would make the property tax comparable to the personal income tax or the harmonized sales tax (HST). The hypothetical revenue consequences of maintaining a constant effective rate are enormous as shown in Figure 5.
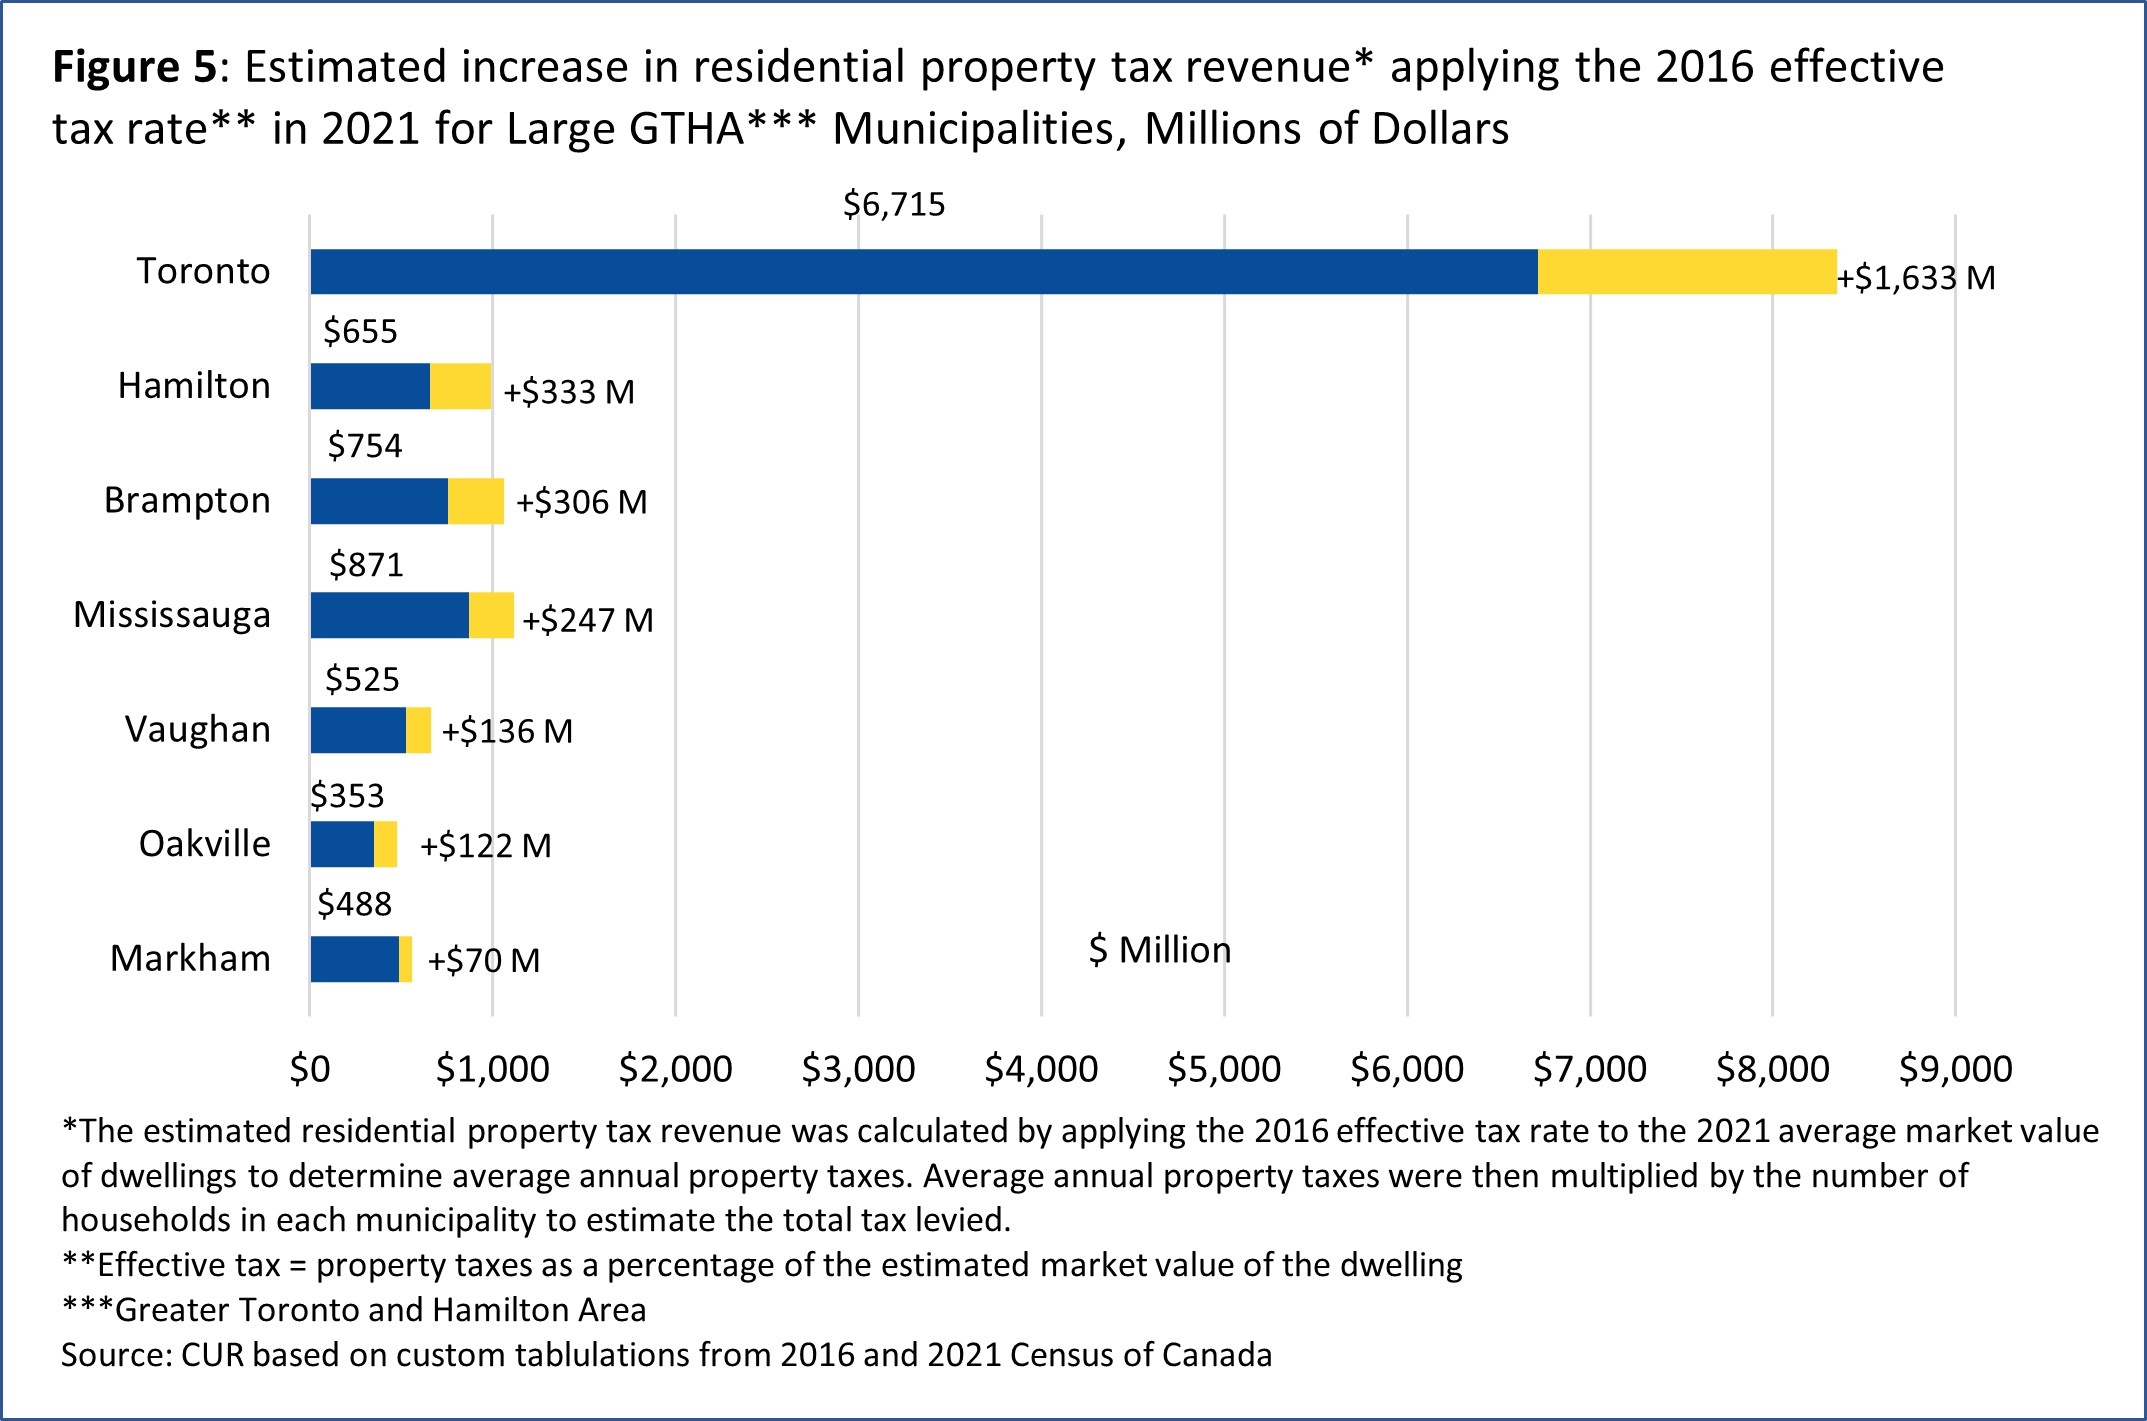
If the effective tax rate had not declined between 2016 and 2021, Toronto would have had $1.63 billion more in tax revenue from owner-occupied dwellings than it collected. The increases for the other seven municipalities ranged from $70 million in Markham to $333 million in Hamilton.
Conclusion
Cities with lower effective residential property tax rates and tax burdens typically have the most room to increase their property tax revenues when they have demonstrated revenue needs. The prime candidate for property tax increases is the city of Toronto, followed by the town of Oakville.
Cities will remain financially constrained if their assessment bases do not track rising property values and they cannot collect more property tax revenues when reassessments are undertaken.
Endnotes
[1] The seven largest cities in the GTHA plus Oshawa which is included to provide regional representation.
[2] Frank Clayton. “How Much Room Does the City of Toronto Have for Increasing Residential Property Taxes?” CUR, February 28, 2019.
[3] The data are from custom tabulations of property tax data CUR ordered from Statistics Canada by municipality and census metropolitan areas within the Greater Golden Horseshoe.
[4] Includes homeowners in all types of owner-occupied dwellings including condominiums where the owners pay property taxes directly. Excludes owners paying property taxes in their monthly payments to their mortgage lender.
[5] Estimates of the market value of owner-occupied dwellings made by respondents to the long census questionnaire.
[6] Estimated property tax payments in 2016 as a percent of household income in the calendar year 2015.
[7] Frank Clayton and Brooke Adams. “Residential Property Taxes: Effective Rates and Burdens Census Metropolitan Areas within the Great Golden Horseshoe, 2021.” CUR, August 8, 2023.
[8] Not all municipalities fund the same services through the property tax. Some services in some municipalities may be funded through user charges rather than property taxes. No allowance is made for these financing differences.
[9] Consumer Price Index, Statistics Canada, percent increase between July 2016 and July 2021.
Appendix
The following table provides the data in Figures 1,2, and 4 for all Greater Toronto and Hamilton Area municipalities. First Nation reserves are excluded.