Toronto CMA Renters Increased Spending on Public and Private Transportation 2010-2019
By: Frank Clayton, Senior Research Fellow
March 26, 2024
(PDF file) Print-friendly version available
Executive Summary
The percentage growth in spending on public transit was rapid for renters and owners in the Toronto Census Metropolitan Area (CMA) between 2010 and 2019. However, the bulk of the growth in transportation spending in current dollar terms went to fund private transportation.
It is encouraging for transit that the spending of both renters and owners grew rapidly in percentage terms between 2010 and 2019 in the Toronto CMA. However, that the bulk of the growth in transportation spending in dollar terms still went to fund private transportation.
Unexpectedly, renters' growth in private transportation spending was strong in both percentage and dollar terms. The much sharper rise seen in private transportation spending by renters than owner households occurred despite a drop in the number of renters owning at least one private vehicle. The increase in renters' spending on private transportation could be distorted by sampling error.
Thus, while household spending on public transit in the Toronto CMA was moving in the direction that transit agencies and advocates desire, it is swamped by the dollar spending on private transportation. It will be a long time before public transportation spending exceeds private transportation spending if the 2010-2019 trends prevail.
Introduction
Statistics Canada (StatCan) regularly conducts a Survey of Household Spending (SHS) to provide estimates of detailed household expenditure as well as incomes and dwelling characteristics for provinces and larger census metropolitan areas (CMAs). This survey has had limited exposure in the research community.
We decided to mine the SHS database to see what it could tell us about transportation spending in the Toronto census metropolitan area (CMA) by household tenure (owners and renters) and transportation mode (public transit and private vehicles). We were keen to ascertain whether there has been a shift in transportation spending from private to public transportation accompanying the planning policies and infrastructure spending promoting transit travel over automobiles in the Toronto commutershed since the mid-2000s.
We secured custom tabulations from SHS for the Toronto CMA. The dataset contains data for 2010 and 2019, the year before the pandemic severely altered income, spending, and commuting patterns.
Some background on the SHS and the transportation spending dataset
SHS is a survey now conducted every second year for a sample of households across Canada. While the survey was conducted from 1997 through 2009, the methodology applied materially changed in 2010, but it has remained consistent since then. The annual survey was conducted up to 2017 but is now conducted every second year.1 Looking at changes since 2019 once the 2023 results are released will be informative.
Sample size
Figure 1 shows the numbers of Toronto CMA respondents by tenure in the 2010 and 2019 surveys.2
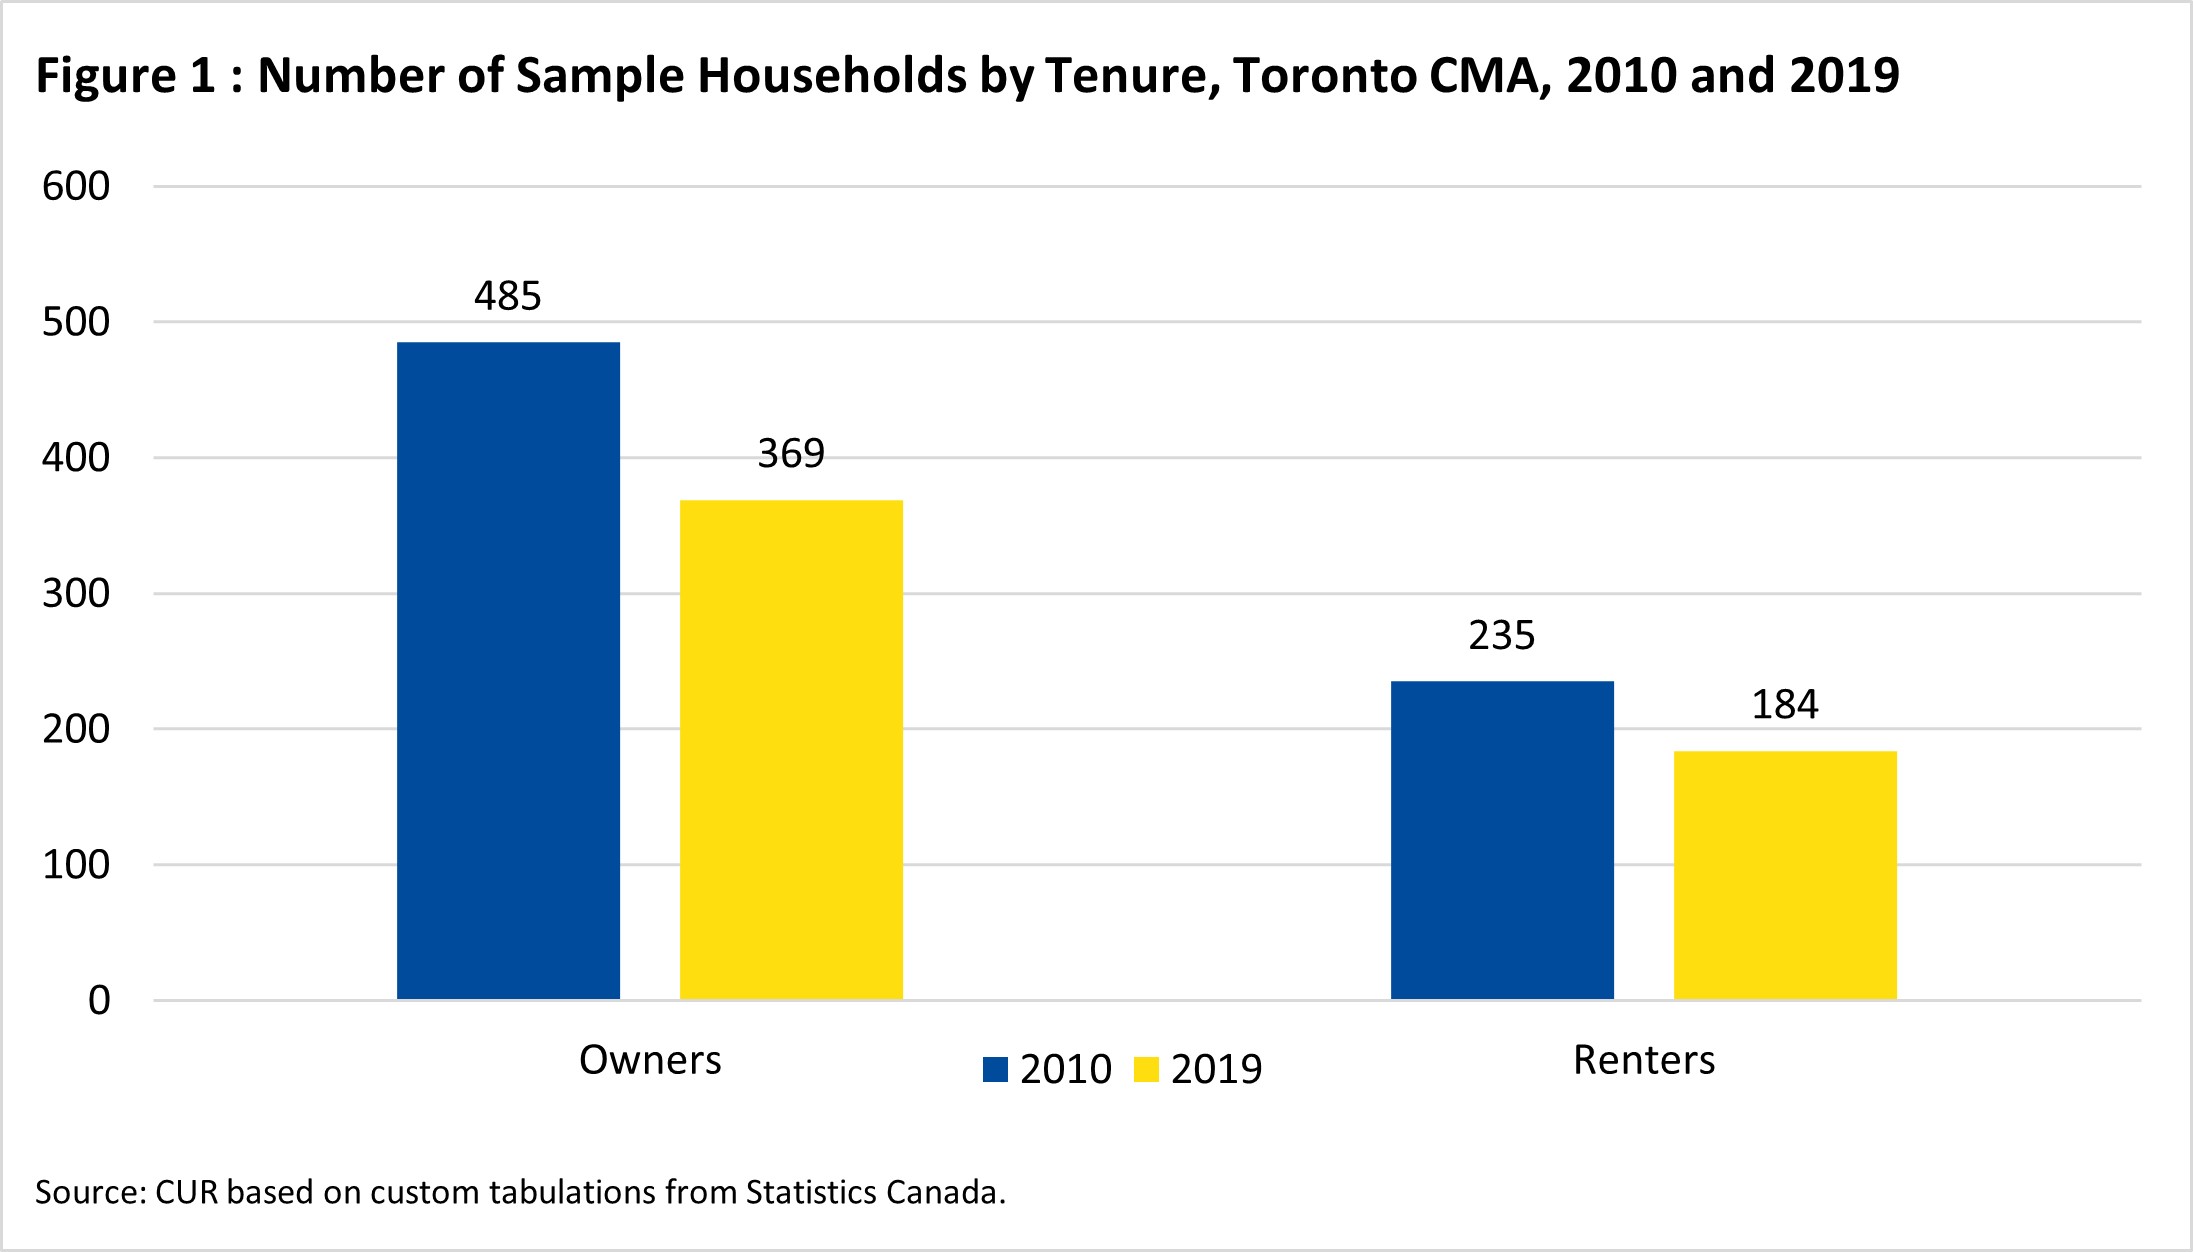
Highlights:
The estimates for individual variables are subject to a sizable sampling error (coefficient of variation):
- The number of survey respondents in the Toronto CMA is relatively small for both of the years examined, and there were even fewer respondents in 2019 compared to 2010;
- In 2019, the total sample was 553 households (369 owners and 184 renters), while in 2010, the total sample was 720 (485 renters and 235 owners); and
- While the survey has a reasonable response rate, it also imputes specific variables for many respondents.
Defining Transportation Spending
For private transportation, the data includes all expenditures associated with purchasing or leasing a personal vehicle (car, van/minivan, or truck), including the purchase price, fuel, maintenance, parts, insurance, parking, and licences.
For public transportation, the expenditures include city or commuter bus, subway, streetcar, and commuter train. Peer-to-peer ride services, taxis, air travel, and intercity bus and train services are excluded.
What the transportation spending data shows
Figure 2 presents the aggregate spending of households in the Toronto CMA by tenure and transportation mode for the years 2010 and 2019.
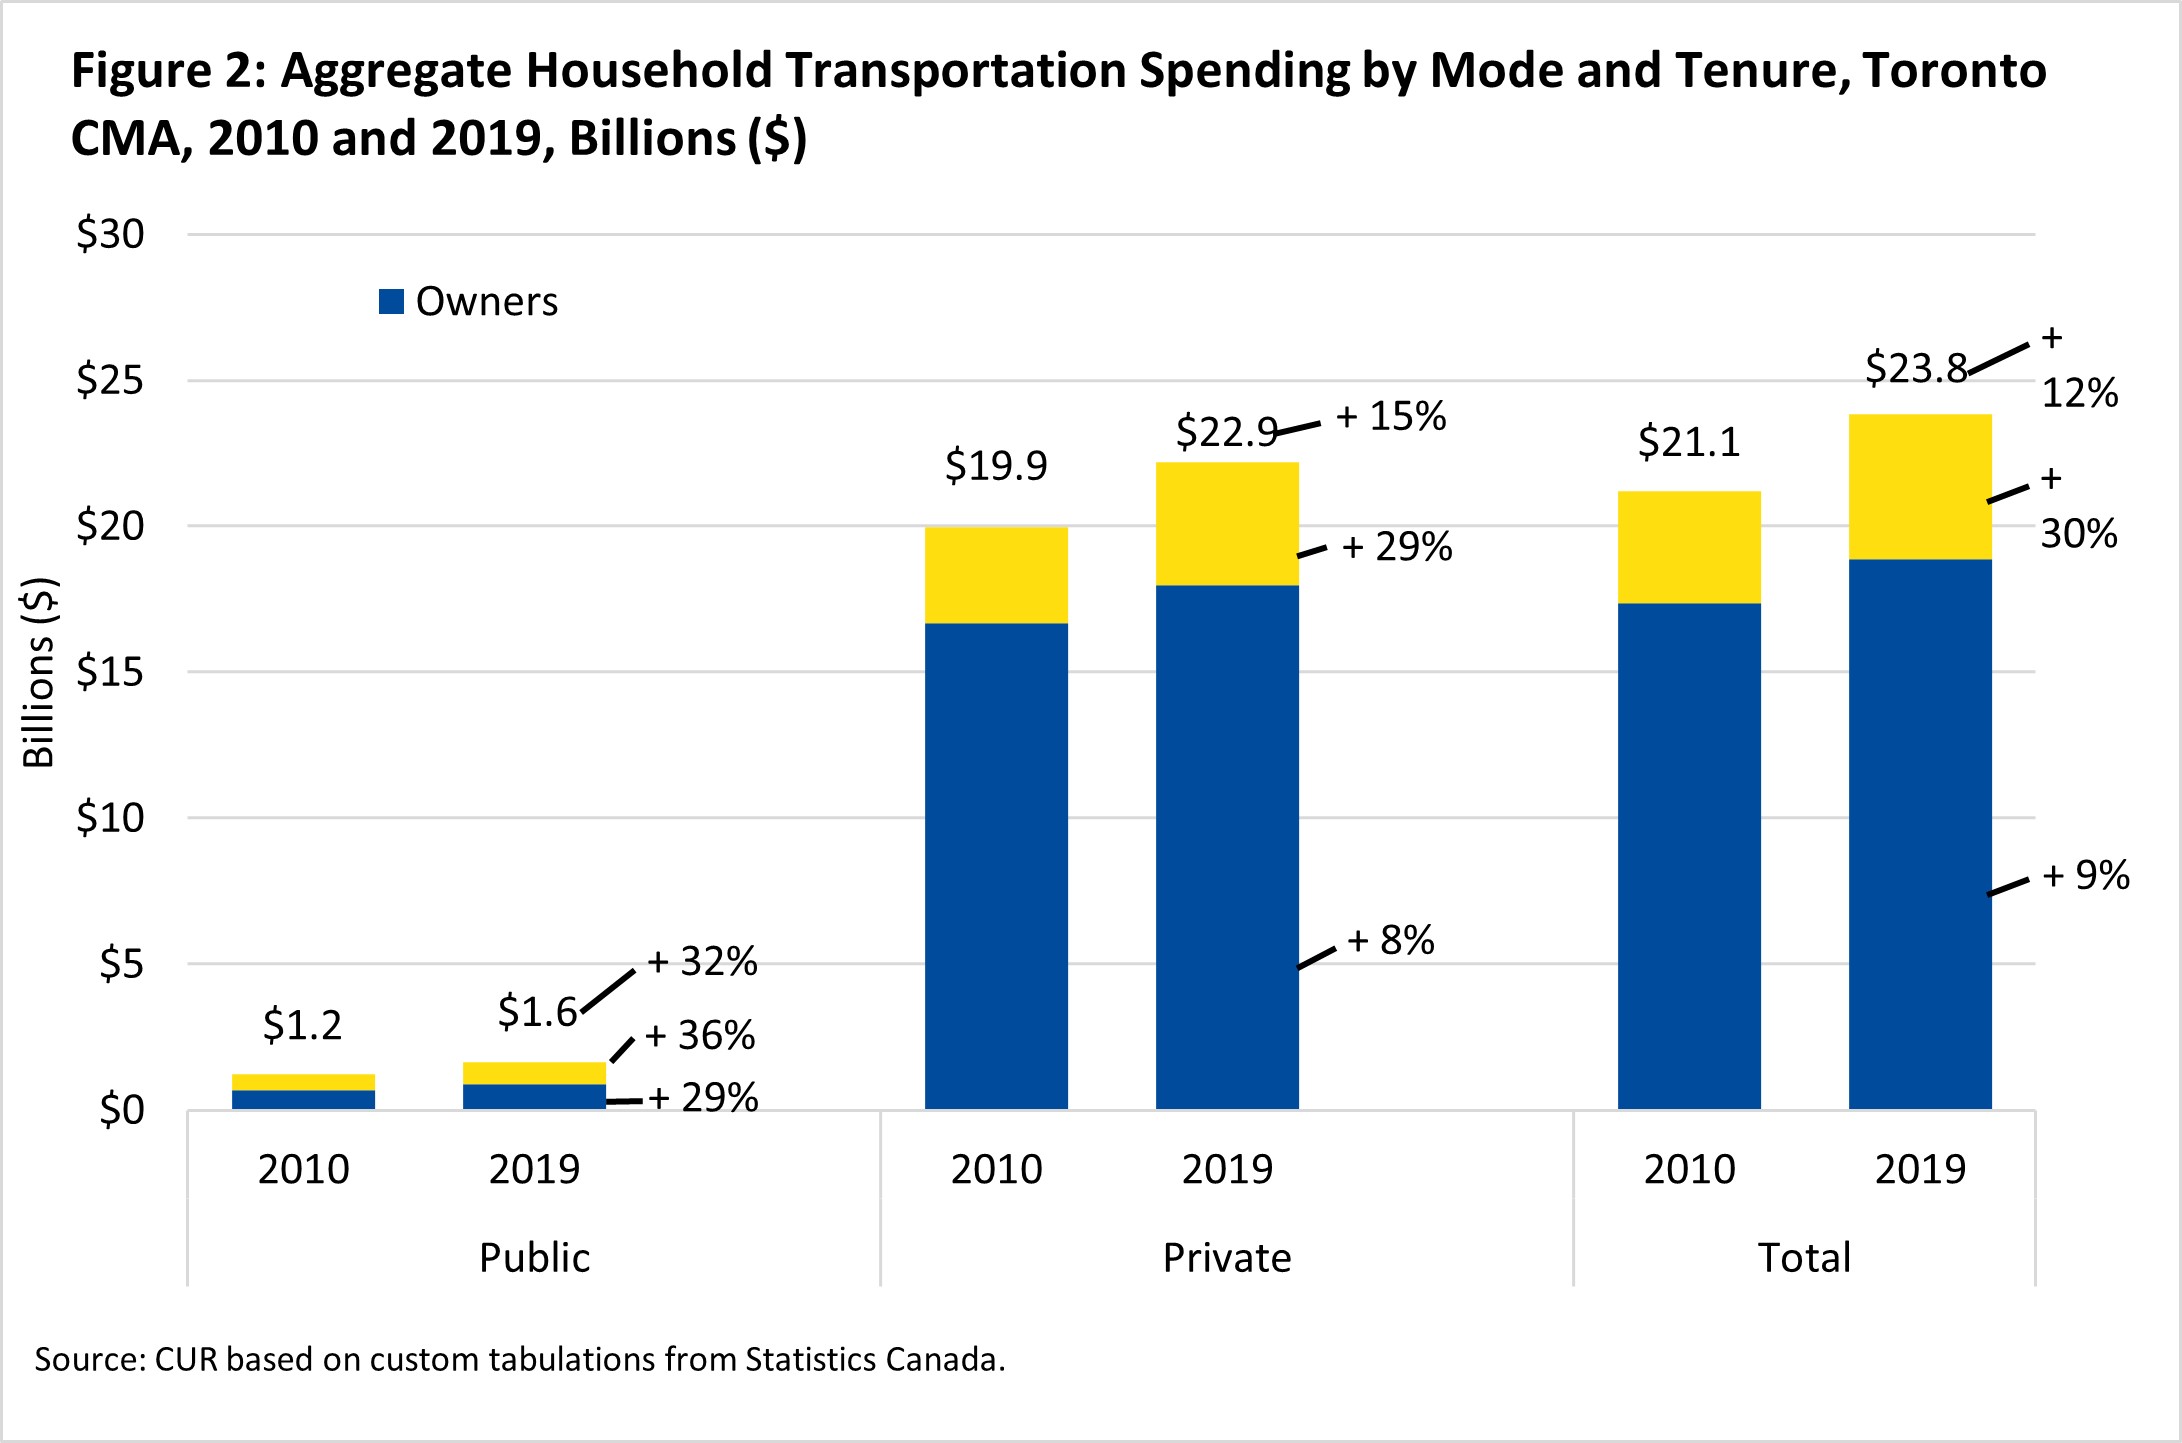
Highlights, 2019
- Homeowners accounted for four of every five dollars spent by Toronto CMA households on transportation in 2019. The $4.9 billion spent by renters is small compared to the $18.9 billion spent by owners;
- Public transportation outlays by Toronto CMA households pale in comparison to spending on private transportation. Toronto CMA households spent just $1.6 billion on public transportation in 2019 compared to $22.2 billion on private transportation (7% of a total of $23.8 billion);
- Toronto CMA renters devoted much more of their transportation dollars to private rather than public transportation. In 2019, renters spent only 15% of their total transportation dollars on public transportation; and
- Homeowners spent an even smaller share of their transportation dollars on transit. Toronto CMA homeowning households spent just 5% of their transportation dollars on public transportation in 2019.
Highlights, Change 2010-2019
- The aggregate transportation spending of renters increased much more rapidly than the spending of owners. Spending by renters on combined private and public transportation climbed by 30% between 2010 and 2019 compared to a 9% increase for homeowner;
- The growth in renter spending was sizable in percentage terms for both transportation modes but skewed to private transportation in dollars. Renter spending on public and private transportation climbed by 36% and 28% between 2010 and 2019. However, in dollar terms, private transportation accounted for 83% of the increased spending; and
- In contrast, the percent increase in owners’ spending was much higher for public rather than private transportation but also skewed to private transportation in dollar terms. Owner spending on public and private transportation increased by 29% and 8% between 2010 and 2019. In dollar terms, private transportation accounted for 87% of the increased spending.
Probing why renters’ spending on public and private transportation increased much faster than owners’ spending
Two variables are explored as potential factors causing the more rapid growth in renters’ transportation spending by mode between 2010 and 2019 – household growth and private vehicle ownership (one or more vehicles).
Total Households
Figure 3 shows total households by tenure for the Toronto CMA in 2010 and 2019.

Highlights
- Renter households in the Toronto CMA grew much faster than owners between 2010 and 2019 – by 20.4% compared to 7.7%; and
- Renters accounted for nearly 60% of the household increase.
A more rapid increase in transportation spending for the two modes would be expected for renters, given their growth relative to owners.
Households Owning One or More Vehicles
Figure 4 shows households owning one or more vehicles by tenure for the Toronto CMA in 2010 and 2019.

Highlights
- Renters owning at least one private vehicle (car, truck, SUV) declined between 2010 and 2019. Renters owning at least one vehicle fell by about 32,000 between 2010 and 2019, a percent decline of 8.2%; and
- In contrast, the number of owner households with at least one vehicle climbed slightly. Owners owning at least one vehicle increased modestly by 36,000 between 2010 and 2019, an increase of 3.1%.
The downward trend in vehicle ownership by renters suggests their private transportation spending should be lagging public spending as renters without vehicles are more dependent on public transportation.
Bottom line
It is encouraging for transit that the spending of both renters and owners grew rapidly in percentage terms between 2010 and 2019 in the Toronto CMA. It is disappointing for transit, however, that the bulk of the growth in transportation spending in dollar terms still went to fund private transportation.
Unexpectedly, the growth in private transportation spending by renters was also strong in both percentage and dollar terms. The much sharper rise seen in private transportation spending by renters than owner households occurred despite a drop in the number of renters owning at least one private vehicle. Sampling errors could be a factor in the growth of spending.
Thus, while household spending on public transit moved in the direction that transit agencies and advocates desired, the dollar volume of spending on private transportation is still significantly larger.
Endnotes
[1] A survey was not launched in 2021 because of the Covid 19 pandemic.
[2] This section is based on information from: Statistics Canada. User Guide for the Survey of Household Spending, 2010. November 27, 2015. and Statistics Canada. Household Expenditures Research Paper Series User Guide for the Survey of Household Spending, 2019. January 22, 2021.
References
Statistics Canada. Custom tabulations from the Survey of Household Spending, 2010 and 2019. https://www.statcan.gc.ca/en/survey/household/3508 (external link)
Statistics Canada. (2015). User Guide for the Survey of Household Spending, 2010. https://www150.statcan.gc.ca/n1/pub/62f0026m/2012001/part-partie1-eng.htm (external link)
Statistics Canada. (2021). Household Expenditures Research Paper Series User Guide for the Survey of Household Spending, 2019. https://www150.statcan.gc.ca/n1/pub/62f0026m/62f0026m2021001-eng.htm (external link)